The Data Management Survey, now in its fifth year, is a BARC research study focused on the data management tools market. Our research is primarily based on a major survey of 960 participants worldwide, and provides a wealth of user feedback on 21 of the leading data management solutions on the market today.
Our user survey covered issues ranging from the selection and purchase of software through to deployment and use, including questions about the success of software projects, the usability of each product and the challenges encountered.
The following links provide more detail on our survey methodology, the survey sample, and how we categorize and score data management tools:
Components of The Data Management Survey
The findings from The Data Management Survey are presented in a number of documents (see below). They do not need to be read in sequence. ‘The Results’, and the ‘Vendor Performance Summaries’ can be read independently.
The Data Management Survey Analyzer, a web-based, self-service tool enables users to carry out their own analysis of the survey results.
The Results
An overview and analysis of the most important product-related findings and topical results from The Data Management Survey 24.
The Analyzer
Our powerful interactive online tool, enabling you to perform your own custom analysis of the full survey data set.
Vendor Performance Summaries
A series of reports on each of the products featured in The Data Management Survey 24. Each report includes an in-depth product review by a BARC analyst plus all the survey results directly related to the product.
Want to buy The Data Management Survey?
All the published survey results and expert analysis at your fingertips + full access to The Analyzer for your own further research
Contact usSample & methodology
Much of the value of The Data Management Survey lies in the large number and distribution of survey responses. With a sample of 960 responses, it is among the largest independent surveys into this topic in the world.
This section describes the characteristics of the people who took part in the study, including information on the type, company size and industry sector of participants.

Sample size and make-up
Many thousands of people were invited to take part in The Data Management Survey 24, using a range of media.
A summary of the online data collected is shown in the table, with the number of responses removed also displayed.
Our data cleansing rules are thorough and involve several different tests. All fraudulent or suspect data that purports to be from bona fide data management software users is removed.
The number of responses is divided between users, consultants and vendors. The questionnaire for vendors contains a different set of questions to those answered by users and consultants.
| Total responses | Responses |
| Total responses | 960 |
| Removed during data cleansing | -48 |
| Total answering questions | 912 |
| Breakdown of responses | Responses |
| Users | 576 |
| Consultants | 194 |
| All users | 770 |
| Vendors/Resellers | 98 |
Organization sizes by headcount
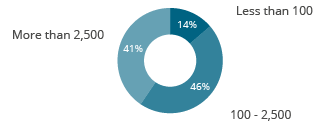
Data management products are mostly found in mid-sized and large organizations, a fact reflected in the high percentage of responses we received from users in companies with more than 100 employees.
Participants from smaller companies (i.e., with less than 100 employees) formed the smallest grouping with 14% of the total number of responses.

Frequency of employee count in respondent organization (n= 690)
Vertical markets
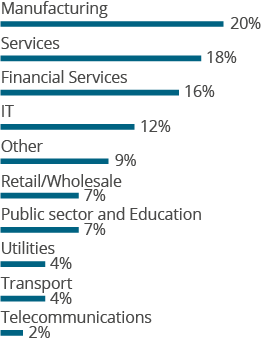
The chart on the right shows the breakdown of survey responses by industry sector. It only includes respondents who answered product-related questions in the survey (i.e., users and consultants).
Manufacturing tops the list with 20% of the sample, followed by services with 18%.

Respondents analyzed by industry (n=814)
Products in The Data Management Survey
21 data management tools are analyzed in detail, having reached the inclusion threshold of 20 user reviews each.
For convenience, the product names we use in The Data Management Survey are sometimes abbreviated and are not always the official product names used by the vendors at the time of publication.
We asked respondents explicitly about their experiences with products from a predefined list, with the option to nominate other products.
Where respondents said they were using an ‘other’ product, but from the context it was clear that they were actually using one of the listed products, we reclassified their data accordingly.
The table to the right shows the data management products included in our detailed analysis.
| Product |
| Alation Data Catalog |
| Amazon Glue |
| Amazon Redshift |
| AnalyticsCreator |
| Collibra Data Intelligence Cloud |
| dataspot. |
| Datavault Builder |
| Exasol Database |
| Google Big Query |
| Microsoft Azure Data Factory |
| Microsoft Azure Synapse Analytics |
| Microsoft SQL Server |
| PostgreSQL |
| Oracle Data Integrator |
| Oracle Database |
| Qlik Data Integration |
| SAP BW/4HANA |
| SAP Datasphere |
| SAP Hana |
| SAS Data Management |
| Snowflake Cloud Data Platform |
| TimeXtender |
Want to rate your BI and analytics software?
Share your experience in the world‘s largest and most comprehensive survey of BI software users
Take part in The BI & Analytics SurveyThe peer groups
The Data Management Survey 24 features a range of different types of data management tools so we use peer groups to help identify competing products. The groups are essential to allow fair and useful comparisons of products that are likely to compete.
The peer groups have been defined by BARC analysts using their experience and judgment, with segmentation based on usage scenario. These functional peer groups are mainly data-driven and based on how customers say they use the product.
Peer groups are intended to help the reader understand which products are comparable and why there is such a disparity of findings between all the individual products. The groupings themselves make no judgment on the quality of the products. Most products appear in more than one peer group.
Analytical database products prepare, store and provide data for analytical purposes.
Technologies that provide data warehouse capabilities as a service in the cloud.
'Yellow pages’ to support search for data and to support governance leveraging metadata in a highly user-friendly environment.
Platforms that help to build up and utilize data knowledge effectively and efficiently utilizing automated processes (e.g., for linking and analyzing a wide variety of metadata from distributed metadata sources).
Data pipelining products take a modern approach to data integration and support more than one data integration pattern. A pattern can be data interaction, data integration, data preparation or even data orchestration in order to get data connected and to make it usable for any kind of business purpose.
Mainly SaaS platforms that provide integrated end-to-end functionality from data integration to analysis with a special focus on business user support to cover self-service requirements.
Data warehousing automation products cover data-driven or requirements-driven data warehouse design and implementation. They mainly focus on the simplification and automation of data integration and data modeling tasks.
The KPIs
The KPIs are designed to help the reader spot winners and losers in The Data Management Survey 24 using well-designed dashboards packed with concise information. There is a set of 26 normalized KPIs (which we refer to as ‘root’ KPIs) and 6 aggregated KPIs for each of the 21 products.
A set of KPIs has been calculated for each of the 7 peer groups. The values are normalized according to the whole sample.
The KPIs all follow these simple rules:
- Only measures that have a clear good/bad trend are used as the basis for KPIs.
- KPIs may be based on one or more measures from The Data Management Survey.
- Only products with samples of at least 15 to 30 (depending on the KPI) for each of the questions that feed into the KPI are included.
- For quantitative data, KPIs are converted to a scale of 1 to 10 (worst to best).
- A linear min-max transformation is applied, which preserves the order of, and the relative distance between, products‘ scores.
- In some instances, adjustments are made to account for extreme outliers.
KPIs are only calculated if the samples have at least 15 to 30 data points (this varies depending on the KPI) and if the KPI in question is applicable to a product. Therefore some products do not have a full set of root KPIs.
Our methodology document describes all the KPIs and calculation methods in detail. See our methodology PDF.
| Aggregated KPIs | Root KPIs |
| Business Value | Business Benefits |
| Project Success | |
| Project Length | |
| Customer Satisfaction | Price to Value |
| Recommendation | |
| Vendor Support | |
| Implementer Support | |
| Product Satisfaction | |
| Sales Experience | |
| Time to Market | |
| Product Enhancement | |
| Functionality | Functional Coverage |
| Self-Learning | |
| Active Metadata | |
| Security & Privacy | |
| User Experience | Ease of Use |
| Adaptability | |
| Deployment & Operations | |
| Development & Content Creation | |
| Competitiveness | Considered for Purchase |
| Competitive Win Rate | |
| Technical Foundation | Performance |
| Platform Reliability | |
| Connectivity | |
| Scalability | |
| Extensibility |

