The Financial Consolidation Survey – a new research study from BARC – delves into the financial consolidation tools market. The basis of the study is a global survey of 531 software users, offering extensive user feedback on 9 of the leading financial consolidation solutions on the market today.
Participants were asked about the selection and purchase of their software as well as a range of questions about deployment and utilization. The survey also addresses the success of software projects, product usability and challenges faced.
Components of The Financial Consolidation Survey
The findings from The Financial Consolidation Survey are presented in multiple documents, including ‘The Results’ and ‘Vendor Performance Summaries.’
These documents can be read independently, and for a personalized analysis, you can utilize The Financial Consolidation Survey Analyzer, a web-based, self-service tool.
The Results
The Analyzer
Vendor Performance Summaries
Want to buy The Financial Consolidation Survey?
Are you interested in seeing the whole picture?
Contact usSample & Methodology
The strength of The Financial Consolidation Survey lies in its extensive and globally distributed sample of 531 participants, making it one of the largest independent surveys in the world on this subject. This section provides insights into the characteristics of study participants, such as company type, size and industry sector.

Sample size and make-up
The survey gathered responses from a diverse group, reaching out to many thousands of individuals through various media channels.
The table displays a summary of participants, with removed responses due to various reasons.
Rigorous data cleansing procedures eliminate fraudulent or suspicious submissions from people purporting to be financial consolidation software users.
The number of responses is divided between users, consultants and vendors. Vendors answered a different set of questions to those answered by users (and consultants answering on behalf of users).
| Responses removed from the sample | Responses |
| Total responses | 531 |
| Removed during data cleansing | -98 |
| Total answering questions | 433 |
| Total responses analyzed | Responses |
| Users | 289 |
| Consultants | 63 |
| All users | 352 |
| Vendors/Resellers | 38 |
Organization sizes by headcount
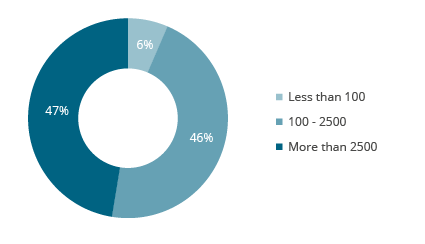
Financial consolidation products are predominantly used by mid-sized and large organizations. The majority of responses came from companies with over 100 employees.
Smaller companies (with less than 100 employees) constituted the smallest participant group, contributing to 6% of the total responses.

Frequency of employee count in respondent organization (n= 433)
Vertical markets
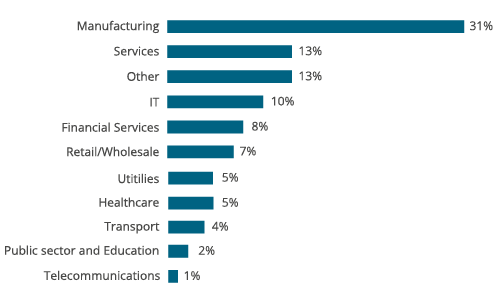
The breakdown of survey responses by industry sector, focusing on users and consultants answering product-related questions, is depicted in the chart.
Manufacturing is the most heavily represented industry with 31% of the sample, followed by services at 13%.

Respondents analyzed by industry (n=433)
Products in The Financial Consolidation Survey
A detailed analysis is conducted on nine financial consolidation tools, meeting the inclusion threshold of at least 18 user reviews each. For ease of reference, the product names used in The Financial Consolidation Survey may be abbreviated and might not always align with the official names provided by the vendors at the time of publication.
Respondents were explicitly asked about their experiences with products from a predefined list, with the option to nominate alternatives. Instances where respondents claimed to use an ‘other’ product, yet it became evident from the context that they were actually using one of the listed products, led to the reclassification of their data.
The table on the right shows the financial consolidation products subjected to our in-depth analysis.
| Product | Number of reviews |
| CCH Tagetik | 22 |
| IBM Controller | 20 |
| insightsoftware IDL | 19 |
| LucaNet | 53 |
| OneStream | 22 |
| Oracle Cloud EPM FCC | 35 |
| SAP BPC | 21 |
| SAP Group Reporting | 18 |
| SAP SEM-BCS | 19 |
Want to rate your BI and analytics software?
Share your experience in the world‘s largest and most comprehensive survey of BI software users
Take part in The BI & Analytics SurveyThe KPIs
The KPIs are designed to help the reader spot winners and losers in The Financial Consolidation Survey 24 using well-designed dashboards packed with concise information. There is a set of 25 normalized KPIs (which we refer to as ‘root’ KPIs) and 5 aggregated KPIs for each of the 9 products.
The KPIs all follow these simple rules:
- Only measures that have a clear good/bad trend are used as the basis for KPIs.
- KPIs may be based on one or more measures from The Financial Consolidation Survey.
- Only products with samples of at least 15 – 20 (depending on the KPI) for each of the questions that feeds into the KPI are included.
- For quantitative data, KPIs are converted to a scale of 1 to 10 (worst to best).
- A linear min-max transformation is applied, which preserves the order of, and the relative distance between, products‘ scores.
- In some instances, adjustments are made to account for extreme outliers.
KPIs are only calculated if the samples have at least 15 – 20 data points (this varies depending on the KPI) and if the KPI in question is applicable to a product. Therefore some products do not have a full set of root KPIs.
| Aggregated KPIs | Root KPIs |
| Business Value | Business Benefits |
| Project Success | |
| Project Length | |
| Competitiveness | Considered for Purchase |
| Competitive Win Rate | |
| Customer Satisfaction | Product Satisfaction |
| Vendor Support | |
| Implementer Support | |
| Price to Value | |
| Recommendation | |
| Sales Experience | |
| Functionality | Modeling Flexibility |
| Predefined Connectors | |
| Data Entry/Upload | |
| Currency Management | |
| Workflow | |
| Intercompany Reconciliation | |
| Consolidation Functionality | |
| Traceability/Auditability | |
| Financial Reporting/Disclosure Mgmt | |
| Financial Planning | |
| Customer Experience | Self-Service |
| Ease of Use | |
| Performance Satisfaction | |
| Innovation | Cloud-Based Consolidation |

