Finding the Right Data Analytics Tool
Advanced analytics (or data science) is data analysis based on mathematical models. These mathematical models represent relationships between variables (e.g., the properties of customers) to derive insights from new data such as customer group affiliation. But it is not only complex models that are necessary to build data science use cases. The data science project cycle comprises several stages from use case identification, preparation of data from various sources, data exploration, machine learning and results evaluation to operationalization and model maintenance. These tasks are not carried out by one single, unicorn-like data scientist but by a team of analytics experts who collaborate during the process, exchanging ideas, data, code, plots and results.
What is the best tool to support this process? Clearly, there is no single tool that covers all the requirements of all analytics teams. Business users might not be fluent coders and are occupied predominantly with explorative and visual analysis of data. Data scientists are focused on using and validating machine learning methods and data engineers on integrating data science solutions into productive systems. Organizations therefore often use a stack of tools including open source as well as commercial analytics platforms.
To make the comparison and search for the best tool for your company easier, this article sets out to provide you with a balanced view of what users of data analytics software – as well as BARC analysts – have to say about the leading advanced analytics products on the market.
By combining our in-depth knowledge of current analytics software tools with our large database of user reviews of advanced analytics software, we aim to guide you through the first steps to finding the best tool for your company.
We believe a combined view of user feedback and in-depth analyst perspective is necessary in order to fully appreciate how advanced analytics, data preparation and data discovery software tools compare against each other, and to understand which are the best ones for your company.
In this article you will find out:
- which are the best analytics software tools as rated by users (Advanced Analytics User Review Matrix)
- how BARC analysts rate and compare the products (BARC Score Advanced Analytics Platforms)
- the most important lessons learned from surveying almost 700 respondents about advanced analytics software usage and selection.
The Advanced Analytics Survey: Head-to-Head Analytics Tools Comparison

The Advanced Analytics Survey: The User Comparison
No one knows more about how an advanced analytics tool performs in the real world than the customers already using it. All too often, they find that products don’t live up to expectations, or that the vendor does not provide adequate support. Therefore, when comparing analytics software, there is almost nothing more valuable than user reviews.
This is where Advanced Analytics Survey can help you. The Advanced Analytics Survey is based on BARC’s BI Survey model, whereby we have been collecting feedback from business intelligence software users every year since 2000. The Advanced Analytics Survey provides detailed analysis of which analytics software products achieve the best user ratings. This year’s Advanced Analytics Survey is based on the analysis of the real-world experience of 677 respondents with 496 answering a series of detailed questions about their use of a named advanced analytics software tool.
This edition features a range of software tools, not only from the well known business software vendors, but also specialist products from smaller providers and open source vendors.
All in all, The Advanced Analytics Survey compares 10 analytics tool (or groups of products) in detail. To be included in the detailed analysis, a tool requires at least 15 user reviews.
Since not all analytics tools are alike, we use peer groups to ensure similar products are compared against each other (see below for more information on the peer groups). The groups are essential to allow fair and useful comparisons of solutions that are likely to compete.
The Advanced Analytics User Review Matrix rates software based on the business value it provides (x-axis), user experience (y-axis), customer satisfaction (color) and analytics (circle size). To see the comparison in action, please select a peer group.
The Advanced Analytics Software User Review Matrix
Not all analytics tools are alike. Some have an easy-to-use UI for data preparation and exploration, while others offer full flexibility for writing machine learning code based on the latest open source libraries. This is why we use peer groups to compare products.
The peer groups are primarily based on the various activities involved in analytical projects and the different user groups. They take into account how customers say they use the software, which can vary substantially from product to product. But we also include the experience and judgment of BARC analysts in deciding on the groupings.
Peer groups are simply a guide to the reader to help make analytics tools easier to compare and to show why individual products return such disparate results. They are not intended to be a judgment of the quality of the tools.
Some products appear in more than one peer group. We use these peer groups in a consistent way in our analysis, as well as in .
The point to the peer groups is to make sure that the comparisons between the analytics tools make sense. The products are grouped together as we would expect them to appear in a software selection shortlist.
To make a proper choice, buyers should first segment the market into the tool types that fit their requirements. The peer groups are intended to help with this task.
The KPIs
The KPI rules
The peer groups
Advanced analytics is a generic term for analysis based on mathematical models. Its aim is to identify relationships between variables in order to derive insights from existing data (patterns) as well as new data (forecasts). This peer group contains advanced analytics platforms that provide a broad range of algorithms. They also offer data preparation and visualization functionality, together with options for model deployment.
Data discovery is the business user/analyst driven process of discovering patterns and outliers in data. This peer group includes products that focus on all the sub-elements of data discovery: data preparation, visual analysis and guided advanced analytics.
Data preparation is the process of cleaning, structuring and enriching data for use in data discovery and/or advanced analytics. This peer group includes products and vendors that support these tasks.
The ‘Software generalists’ peer group includes products which are part of a vendor‘s broader business software portfolio. Customers that standardize on such vendors may be more inclined to select their standard provider’s solutions.
BARC Score Advanced Analytics: The Analyst Comparison of Leading Tools
Advanced analytics is increasingly being adopted across all industries. To make analytics work, a variety of tools is available on the market.
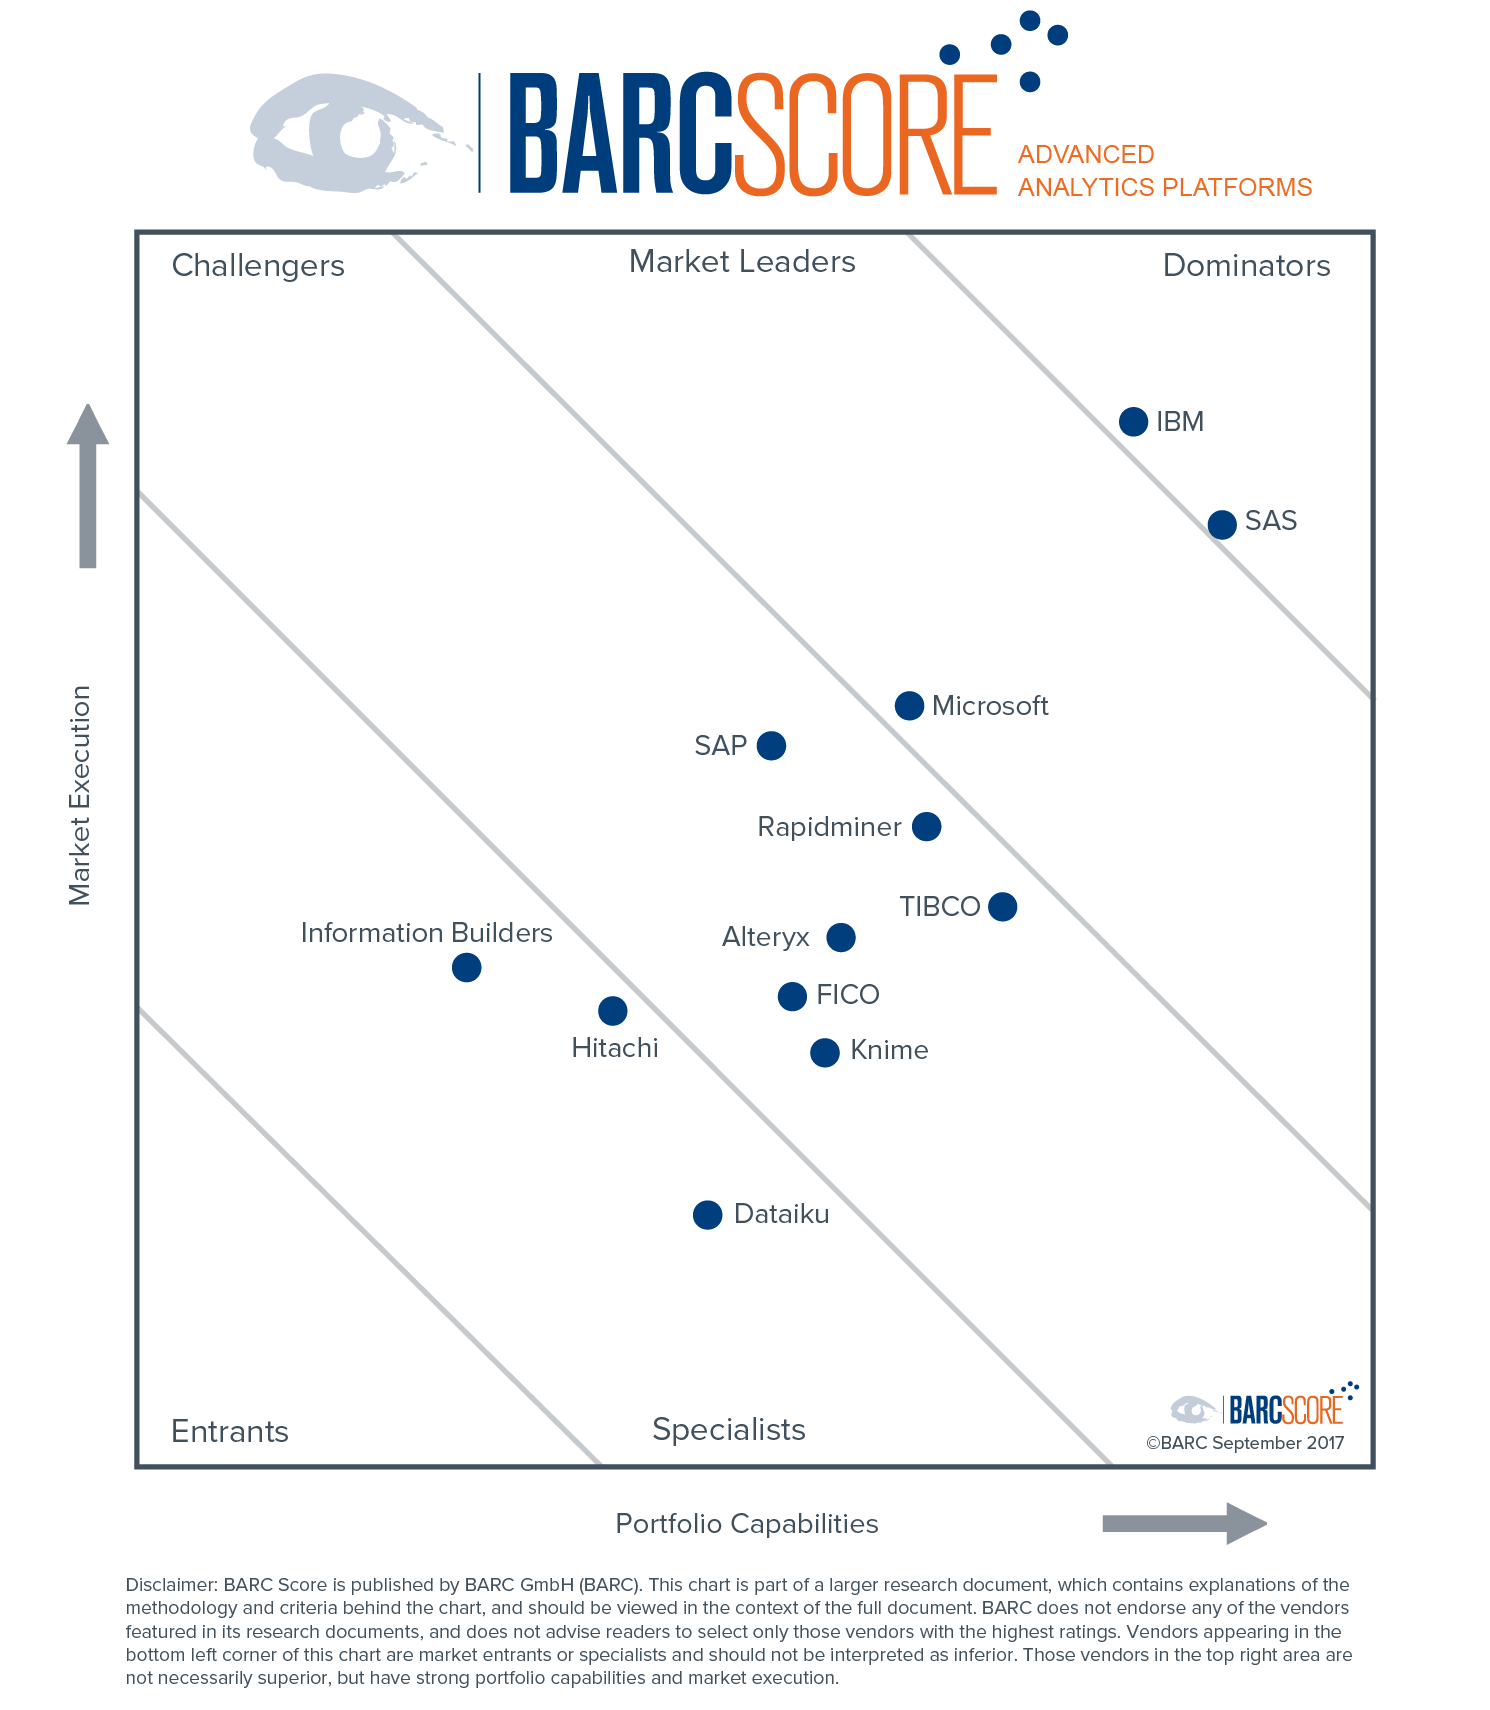
‘BARC Score Advanced Analytics Platforms’ analyzes the strengths and challenges of all of the leading vendors in the advanced analytics market as well as several smaller vendors that often have less visibility, but equally offer outstanding value to their customers.
Based on countless data points and many analyst interactions, advanced analytics software vendors are rated on a variety of criteria, from product capabilities and architecture to sales and marketing strategy, financial performance and customer feedback.
Calculating the individual ratings for all criteria and all vendors produces two scores per company: the ‘portfolio capabilities’ score and the ‘market execution’ score, which are plotted on each axis resulting in the vendor’s dot on the BARC Score graphic.
‘Portfolio Capabilities’ includes a series of weighted criteria based on three major areas: functionality, infrastructure and product-related evaluation criteria.
‘Market Execution’ takes into account a blend of product, sales and marketing strategy as well as certain organizational, financial and geographical considerations.
There are three separate inclusion criteria for this BARC Score: the first is associated with a vendor’s product characteristics, the second is linked to the financial results and the installed user base relating to those products, and the third refers to the regional distribution and support of the software.
Data mining and predictive analytics cover a range of tasks. The two main tasks executed with data mining are unsupervised learning (finding patterns in unlabeled data) and supervised learning (inferring information from labeled data). In addition, common applications of predictive analytics include forecasts based on time series analysis. To be evaluated in this Score, a vendor has to cover all these three areas as they are related and may, depending on the task, build on each other. In this BARC Score, only software that enables users to specify their own workflows is considered for inclusion.
In addition, the vendor has to generate a minimum of 1 million EUR in license revenue per year with the above product set, spread across two regions of the world. In order to accommodate vendors with an open source business model that have also gained popularity in commercial applications, we also include software that has an installed user base of at least 10,000 users.
BARC Score Advanced Analytics Platforms
Score Regions
Want to rate your BI and analytics software?
Share your experience in the world‘s largest and most comprehensive survey of BI software users
Take part in The BI & Analytics Survey
Selecting Analytics Tools – Experiences from the Advanced Analytics Survey 2019
A formal competitive software selection process before purchasing is the best approach to choosing a software product and we highly recommend selecting software products in this way. First and foremost, it is essential to evaluate in detail whether a product fits the technical and functional requirements of a company.
Comparing different products in a detailed evaluation before purchasing also reduces the risk of choosing the wrong product. Formal product selection processes are still more common with business intelligence software than with advanced analytics platforms. We therefore have collected some of the results that highlight the current state of how software is chosen and what the benefits are.

Status quo of product selection
As figure 1 shows, many companies are aware of the necessity of a competitive software selection process in order to select the right software product. 62 percent of respondents say their company conducted a formal product selection process before purchasing an analytics software. To examine correlations between what the most successful companies do differently to less successful ones, we classify companies as ‘best-in-class’ and ‘laggards’.
Best-in-class companies comprise the top 10 percent of companies (approx.) based on their achievement of business benefits, while the lowest 10 percent (approx.) are classed as laggards. As figure 2 displays, laggards somewhat underestimate the importance of a formal selection process. Best-in-class companies do carry out formal product selections more often as figure 2 shows, roughly twice as often.
As a consequence, the business benefits achieved and the satisfaction level that laggards experience with both vendor and software is behind that of best-in-class companies. Laggards also face many more problems than best-in-class companies during implementation and when using their analytics software.
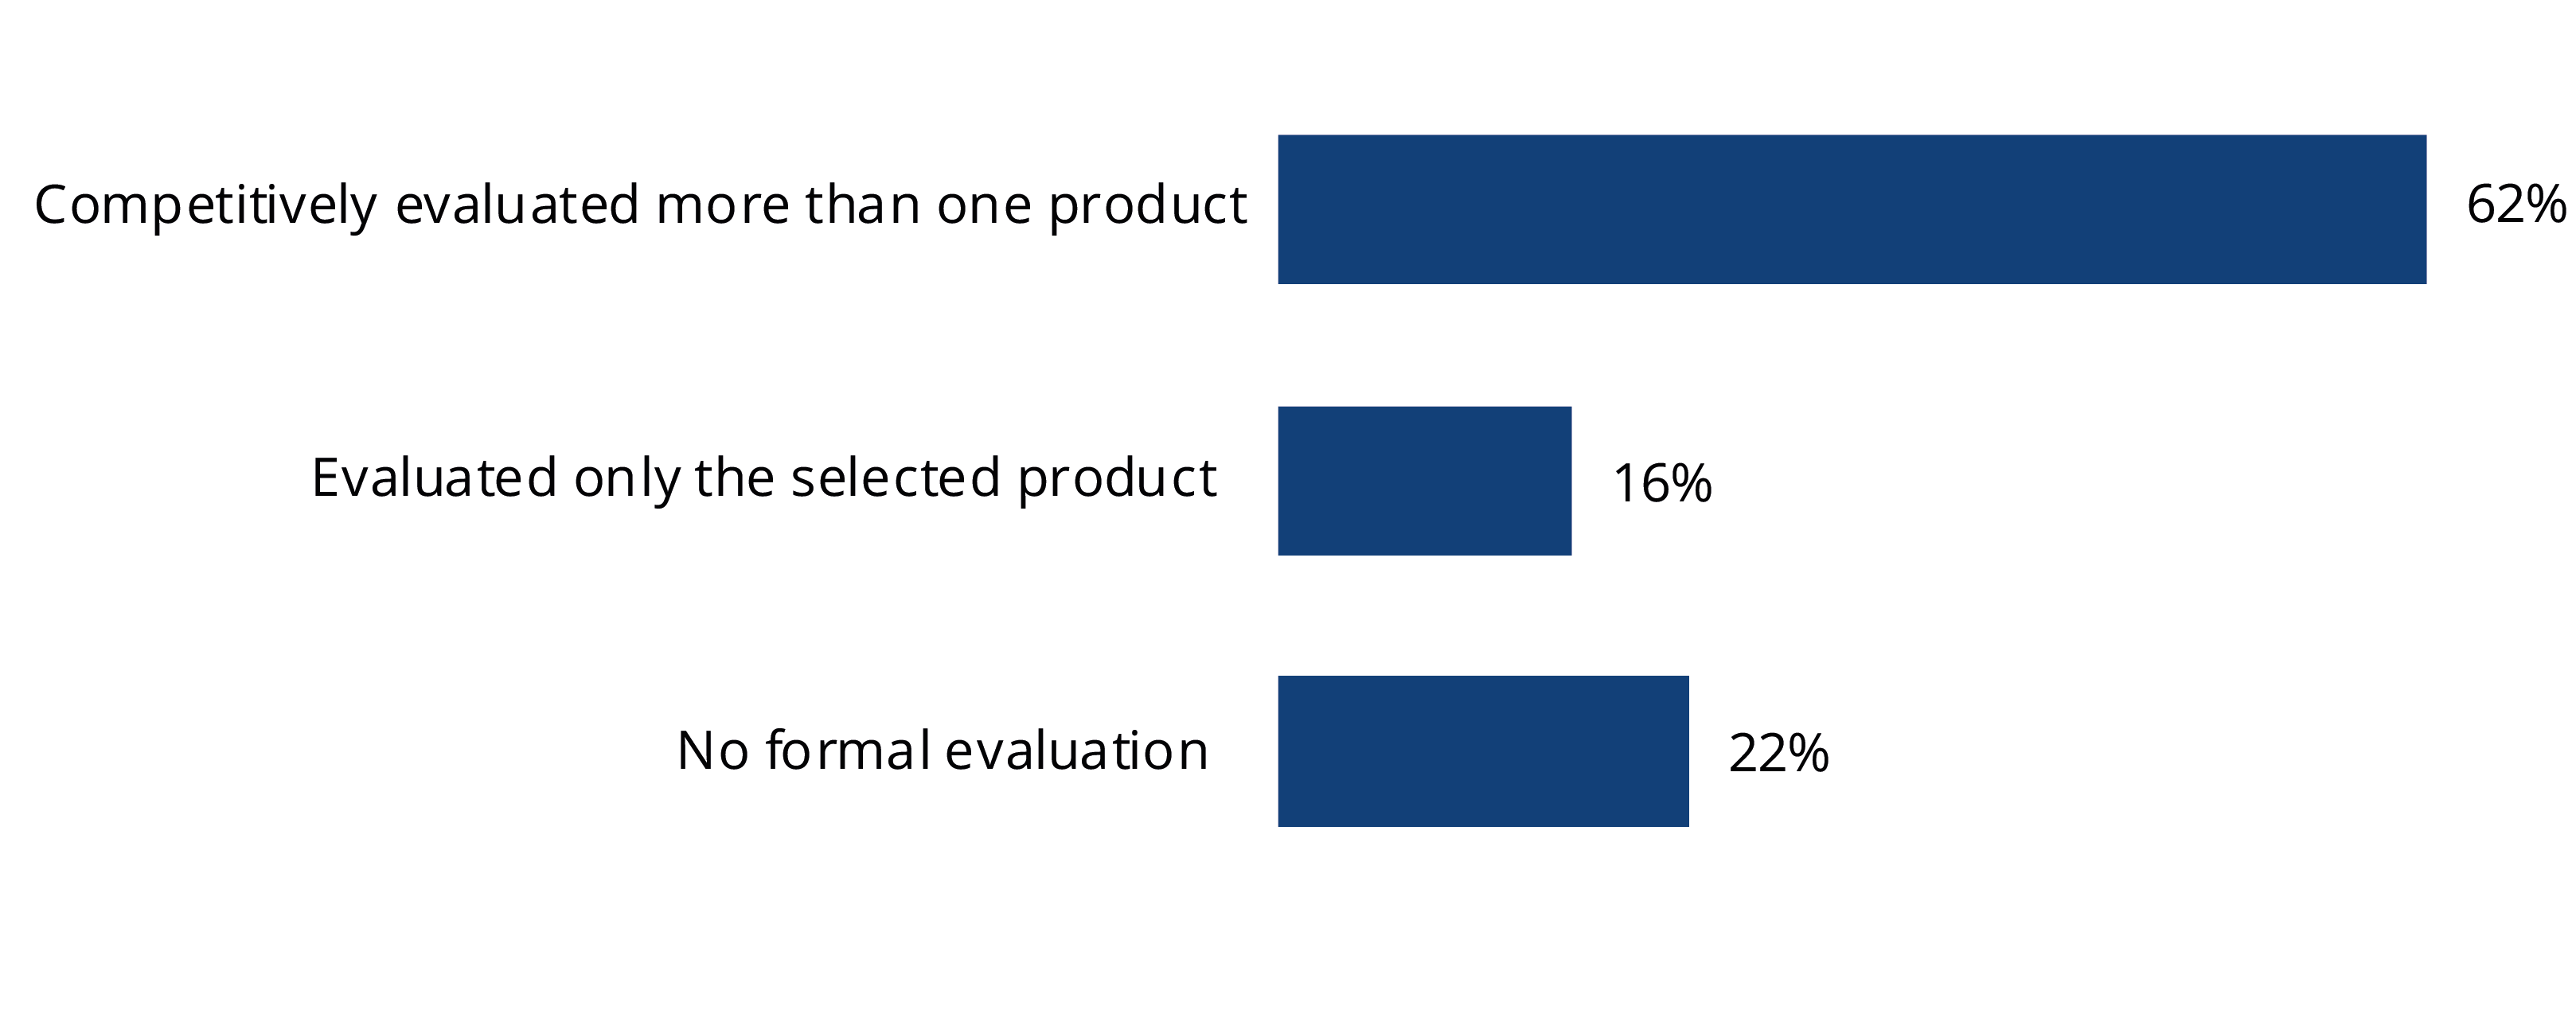
Figure 1: Proportion of organizations that conducted formal product evaluations before purchase (n=316)
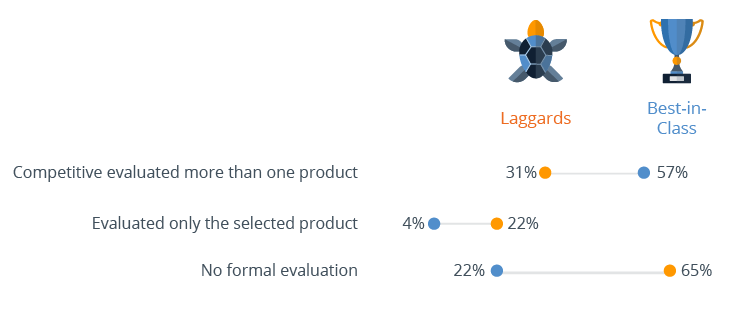
Figure 2: Proportion of organizations that conducted formal product evaluations before purchase – by best-in-class (n=63)

Software selection – Product level analysis
When analyzing the survey data at product level, additional insight emerges into which products are chosen more frequently without a formal evaluation and which regularly figure in competitive situations. Data preparation and data exploration products, such as Qlik and Tableau, are often chosen after formal evaluation processes.
83% of the respondents using Qlik and 79% of the respondents using Tableau chose their software after a formal process. Formal product evaluation is still more common with BI products. We observe much higher rates of formal selection processes with BI tools than with advanced analytics platforms such as Alteryx or Rapidminer which are formally evaluated by only 46% and 50% respectively. After Qlik and Tableau, SAS and Dataiku are evaluated in formal processes by 74% and 70% of customers respectively.
Many companies are still not at the stage where they recognize the need to purchase analytics platforms. They often start with open source software and purchase commercial software when data governance, model deployment and model management issues become more important in the course of operationalization.

Problems encountered by users
Looking at the problems encountered by companies that perform formal product evaluations compared to those that don’t (figure 3), we see that slightly more companies do not experience significant problems when they evaluate the product they are using in advance.
Analyzing the problems in detail, we observe that internal organizational problems such as the acceptance of the product by data scientists are experienced less frequently when formal evaluations are carried out. Users also experience fewer technical issues such as poor data governance, finding the software difficult to use or missing features when multiple products are evaluated competitively.
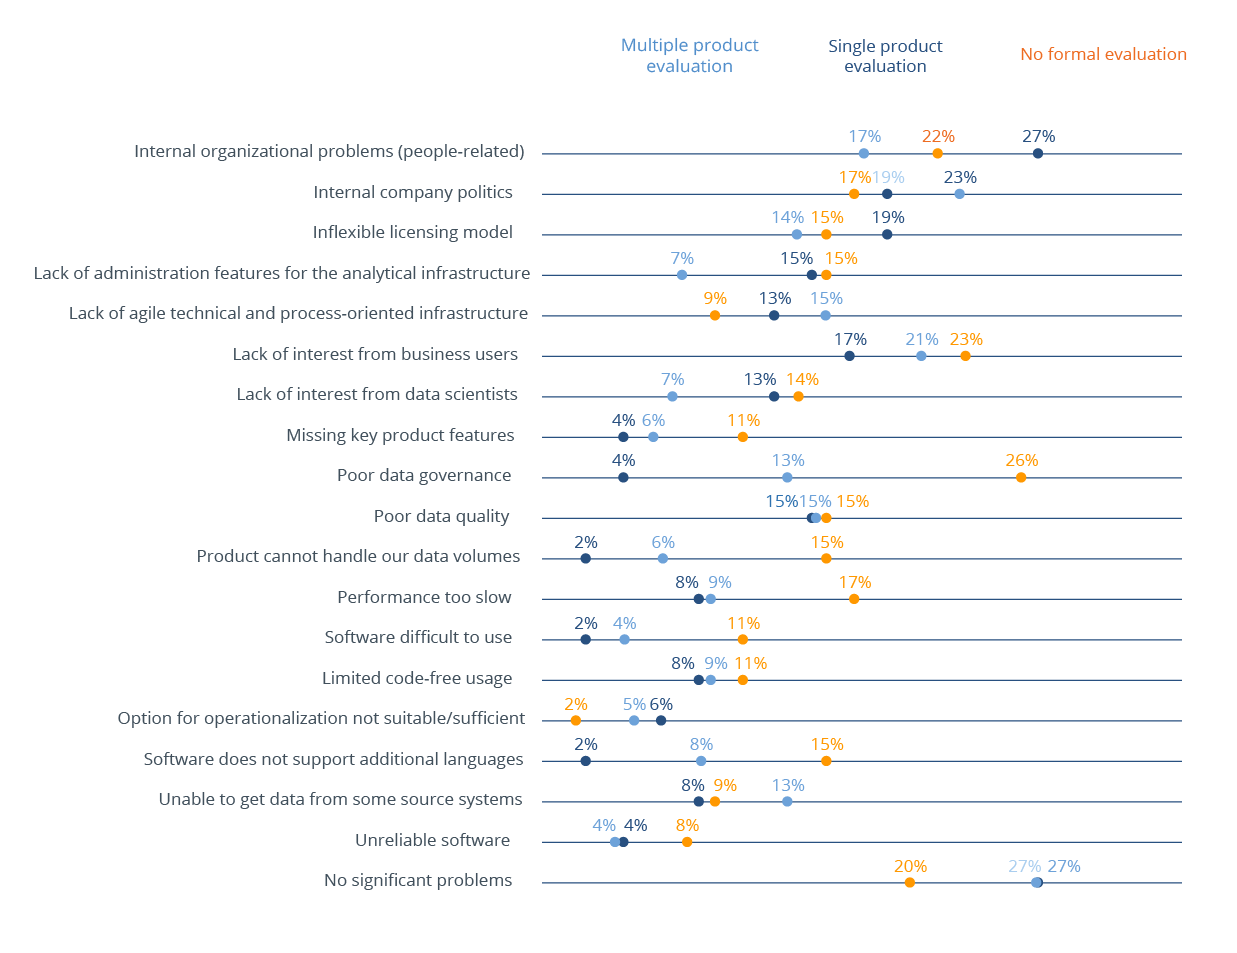
Figure 3: Proportion of organizations that conducted formal product evaluations before purchase (n=302)
What are the right criteria for evaluating advanced analytics software?
The criteria best-in-class companies apply for a selecting their analytics software confirm that successful projects are based on selecting the tool rather than the vendor. 63% of best-in-class companies choose their analytics software for its ease of use for business analysts, while only half of laggards do so.
Innovative capacity of the vendor is the next most important criterion for best-in-class organizations. In a fast-changing sector such as analytics and artificial intelligence, innovation is key for sustained satisfaction. Ease of use for data scientists, a code-free environment and coverage of specific requirements are the next most important criteria.
It is noteworthy that all the most important software selection criteria for best-in-class companies are considered important by only 50% or fewer of the respondents from companies classified as laggards.
