Qlik
Qlik, originally founded in 1993 in Lund, Sweden, moved its headquarters to the United States in 2005 after raising funds from several venture capital firms. QlikView, the company’s virtually unknown product at the time, was very aggressively marketed after the VC investment. This created enormous attention and traction, and in 2010 Qlik went public on NASDAQ. In 2016, Qlik was acquired by the private equity company Thoma Bravo and delisted from the stock exchange.
Until the general availability of Qlik Sense in 2014, Qlik was a one-product company. Today, the vendor provides a portfolio of visual analytics offerings. Qlik focuses on integrating different data sources and empowering data governance (data), supporting people with its platform (people) and supporting analysis using its associative model (ideas).
Qlik’s platform consists of several components including Qlik Sense Enterprise and Qlik Sense Cloud, as well as the Qlik Analytics Platform for developers, QlikView and Qlik NPrinting, acquired with Vizubi in 2015 for enhanced printing and page-based layout. Qlik DataMarket is a market for sourcing external data for analyses such as weather or currency information. In 2017 Qlik acquired its Swedish partner Idevio (now Qlik GeoAnalytics) to provide advanced features in the area of spatial analysis.
Qlik Sense is positioned as a self-service data visualization and data discovery solution providing immediate analysis results. It is powered by Qlik’s associative engine QIX, and gives flexible access to data sets stored in-memory. Qlik has significantly improved the business user-friendliness of its data preparation module by adding visual preparation and profiling where scripting was previously required. These improvements have enhanced productivity for developers in data preparation and have also made data preparation accessible to less technically oriented users.
Qlik NPrinting is a report generation, distribution and scheduling application which can be used to create reports based on Qlik Sense or QlikView content. It enables organizations to create reports in a variety of popular formats including Office and pixel-perfect PDF files.
QlikView is a dashboard and analysis product based on in-memory technology targeted at business users. However, while QlikView addresses the common challenges that business users see in IT-run BI systems, the potentially high amount of scripting in complex QlikView installations (compared to Qlik Sense for instance) requires trained staff to produce scalable and high-performance solutions.

User & Use Cases
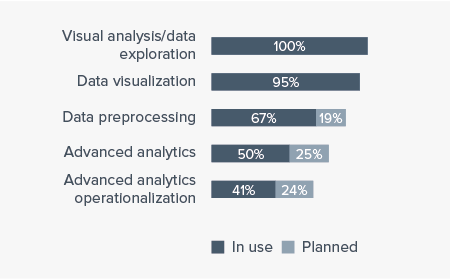
Customer feedback confirms that Qlik primarily offers products for data visualization and visual analysis in data sets. However, 50 percent of respondents use the solution to display advanced analytics results and 41 percent for operationalization of advanced analytics. These usage scenarios, combined with a relatively low number of advanced analytics users, indicate that applications are built by few developers who incorporate analytical results and presented to a broader audience. We regularly see Qlik applications used to visualize operational data. Often the data from Microsoft ERP systems is displayed using Qlik. The fact that Microsoft is cited as a regular competitor to Qlik by survey respondents – and the product’s strong usage in mid-sized companies – support this observation.
Current vs. planned use
N=
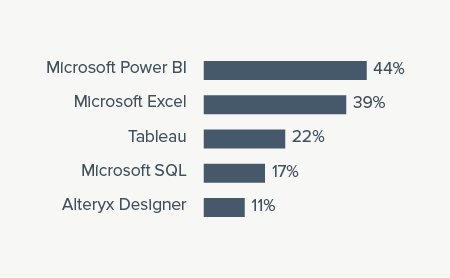
5 products most often evaluated in competition with Qlik
N=
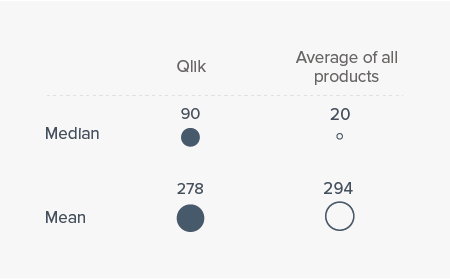
Total number of users per company
N=
Advanced analytics users per company
N=
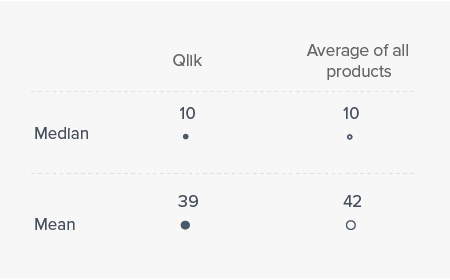
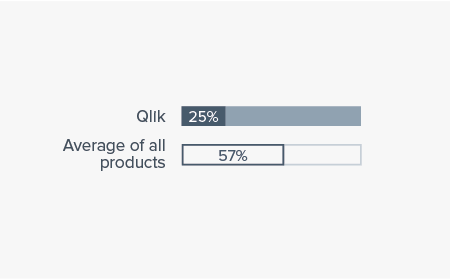
Advanced analytics users (as a percentage of all users)
N=
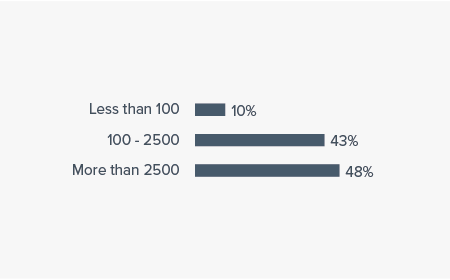
Company size (number of employees)
N=