Visualization and explorative data analysis for business users (known as data discovery) have evolved into the hottest business intelligence and analytics topic in today’s market. 2,800 BI professionals confirmed its importance for the second year in a row in BARC’s BI Trend Monitor 2017.
In this article, we will explain our view on data discovery and its value for companies. Results from The BI Survey and BI Trend Monitor will demonstrate how BI professionals rate the importance of this trend and its increasing adoption in recent years. Finally, we will provide a short overview of the data discovery tools available on the market today.
What is data discovery?
Data discovery is not a tool. It is a business user oriented process for detecting patterns and outliers by visually navigating data or applying guided advanced analytics. Discovery is an iterative process that does not require extensive upfront model creation. We cluster it into three main categories:
- visual analysis; and
- guided advanced analytics.
Data discovery requires skills in understanding data relationships and data modeling as well as in using data analysis and guided advanced analytics functions to reveal insights.
Data integration and data preparation (i.e., data integration for business users) capabilities help business users to connect to relevant enterprise and external data sources (e.g., those provided by partners). As data is becoming increasingly complex, users require flexible functions to be able to efficiently access and prepare their data for analysis.
Interactive and new visualization types enable decision-makers to see, within an instant, major trends, as well as spot outliers.
Visualizations make use of our brains’ pattern recognition capabilities to digest information at a glance or even pre-attentively. Users are better at finding insights and detecting outliers if data is presented in charts and graphs on one page, versus being buried in data tables spanning multiple pages.
Visual analysis is an important feature that is increasingly being sought by enterprises seeking more efficient ways for decision-makers to absorb and act on data.
Furthermore, guided advanced analytics functions provide statistical information on data which users can employ for more sophisticated and pattern oriented data analysis. It is a challenge to provide ready-to-use advanced statistical functions for business users and deliver proper outcomes without the need to write code.
The guidance users can expect from today’s leading data discovery tools has not only enabled access to advanced functions, but also to automated suggestions of suitable algorithms to tackle certain business problems and evaluations of the outcomes of different algorithms.
This area has seen a lot of investment – by both vendors and customers – in recent years. Our market research results confirm the importance of data discovery.
Data discovery is currently amongst the hottest BI trends
Almost all respondents who contributed to the 2017 BARC BI Trend Monitor see data exploration and visualization as important trends.
Importance of Data Discovery in 2017 (n=2,772)
Surprisingly, IT users, consultants and vendors attach more importance to data discovery than actual business users do.
Furthermore, it is interesting to see that the DACH region is lagging behind other countries and regions, while companies from Northern Europe, France and South America consider the trend more important.
Importance of Data Discovery (Timeline)
User adoption of data discovery is growing steadily
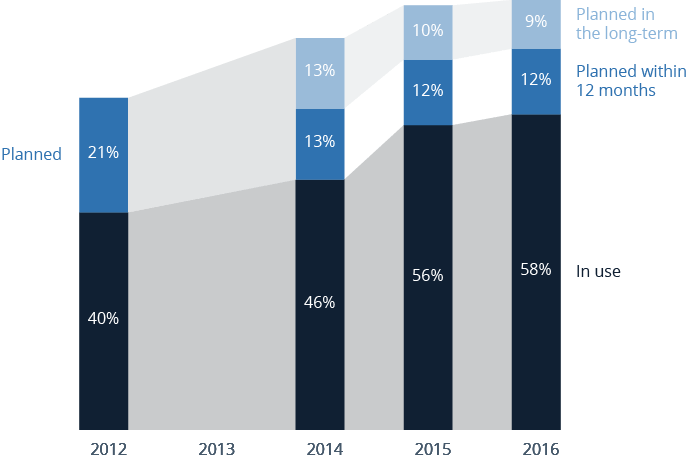
The percentage of respondents saying they use data discovery saw a significant increase of 18 percent from 2012 to 58 percent in 2016. Another 21 percent are planning to implement data discovery use cases in the future which leads to the conclusion that almost 80 percent of the market will depend on their business intelligence tool to address this use case within 3 to 5 years.
Data Discovery Usage
Why is data discovery creating so much buzz?
Data is commonly seen as the oil of the future providing high value for innovation and success.
This new data-driven approach aims to go beyond mere reporting and monitoring of the organization’s performance, which has been the core of traditional BI initiatives. The goal is to exploit the full value of data to not only improve decision-making but to directly impact the optimization of business processes and to fuel new business models.
The high demand for data discovery tools reflects a huge shift in the BI world towards increased data usage and the extraction of insights and patterns from data.
This means operational decisions and long-term planning are based on data and insights. In order for this to work, employees need relevant and reliable information in a timely fashion.
Digitalization demands the democratization of data usage to enable as many employees as possible to reveal insights in corporate or external data. To ensure a closed loop of information usage, data discovery tools should first of all be regarded as complementary to traditional BI.
Concepts such as governance are important to ensure the re-use of insights gained from the data discovery process and user-oriented solutions are needed to provide business users with a proper toolkit for data analysis.
Business users require software that …
- … is easy to use, code-free and not dependent on deep technical or statistical knowledge.
- … is agile and flexible, so users can find answers to their questions ad hoc without relying on the help of IT to set up a complex environment prior working with the data.
- … reduces time to insight since users need to gain insight as quickly as possible and act on it to stay ahead of the competition.
- … allows easy handling of a high volume and variety of data as the large amount and increasing variety of data require more efficient and user-oriented methods of presentation to make sense of them.
Because visual data discovery software meets these demands far better than most traditional business intelligence software suites, it comes as no surprise that it is currently capturing the attention of BI professionals, and that the major BI suites are now being extended to cater for these requirements.
Tools to support the data discovery process
There are several software solutions that support one or all of the aforementioned steps of the data discovery process. Most tools support more than one category.
The following overview of tools for data preparation, visual analysis and guided advanced analytics reflects the main focus of the software and not its full functional spectrum.
However, all of the data discovery tools have the following characteristics in common:
- They target business users and provide a code-free environment for data discovery.
- They support access to a good set of data sources.
- They often provide data preparation and modeling capabilities such as join data from different sources.
- They often support visual and easy-to-digest representations of data.
- They often allow interactive navigation within visualizations.
- Some of them provide out-of-the-box guided advanced analytics features to support statistical analyses.
- They offer options for sharing insights with other colleagues.
- Seamless integration of data preparation, analysis and analytics.
The following list shows some of the common data preparation, visual analysis and guided advanced analytics tools. There are of course many others not mentioned here:
- Alteryx
- Cirro
- ClearStory Data
- Dataiku
- Datameer
- Datawatch
- Informatica REV
- Lavastorm Analytics
- Paxata
- Platfora
- Sagent DataFlow
- Sisense
- Talend Data Preparation
- Trifacta
- SAP Agile Data Preparation
- Advizor
- Comma Soft
- Dimensional Insight
- IBM Watson Analytics
- Information Builders InfoAssist+
- MicroStrategy Visual Insight
- Oracle Big Data Discovery
- Oracle Data Visualization
- SAP Lumira
- SAP BO Cloud
- SAS Visual Analytics
- TIBCO Spotfire
- Coheris
- Dell Statistica
- HP Haven
- IBM SPSS
- KNIME
- OpenText Big Data Analytics
- RapidMiner
- Rosslyn Analytics
- Salesforce (BeyondCore)
- SAP Predictive Analytics
- SAS Visual Statistics
Find out how users rate some of these tools in our BI User Review Matrix, which offers a high-level comparison of the best visual discovery-focused software solutions. This BI Survey peer group consists of BI products that excel in visual analysis. See also The BI Survey results for the business intelligence tools in the visual-discovery-focused products peer group.
BARC Data, BI and Analytics Trend Monitor 2024
The full study features analyst commentary and user ratings of 20 trends in the BI and analytics market
Request the free report nowRecent Articles

Is Data Mesh a Sustainable Approach to Data Responsibility in the Business?
This BARC report discusses whether data mesh is a sustainable approach to data responsibility in the business, based on a survey of 345 companies worldwide.

ESG Challenges, Tools and Outlook
"The State of ESG & Sustainability Reporting – Challenges, Tools & Outlook" addresses ESG reporting, how leading organizations approach it, their motivation for doing it, and the tools that they use.

Modeling, Modernization and Automation
"Data Warehouse and Data Vault Adoption Trends" examines data warehouse and data vault adoption trends in modern analytics environments, including architecture types, priorities, and automation.