Tableau
Tableau Software emerged from scientific research at Stanford University and was founded in 2003. The company has achieved strong growth and is now among the best-known BI and analytics vendors worldwide. Tableau was acquired by Salesforce in 2019. However, it remains a mostly independent business unit focusing on its target audience. At the end of 2021, the vendor acquired Narrative Science, a specialist in the area of natural language generation to boost its ability to provide automated insights in a written-language format that people can easily understand.
Tableau offers a BI and analytics platform that aims to help customers build their data cultures to empower better decision-making. Self-service data analysis is combined with self-service data management to enable companies to harness the power of their data assets. The vendor is committed to developing software that requires little training and allows business users to interpret data, mostly by means of interactive visualization.
Its intuitive user interface, built-in intelligence and option for in-memory data processing to optimize performance contribute to the popularity of this solution for visual analysis, dashboards and data discovery. Tableau’s openness to a variety of data sources is one of its strengths, as it is not necessary to rehost data to use Tableau. The solution allows users to query data live from different data sources, to combine data from across these sources, or to move the data into its own ‘Hyper’ in-memory database for analysis.
Data preparation in Tableau can be quick as many manipulations can be made directly while analyzing data, enabling a truly iterative approach to data discovery. With Tableau Prep, data preparation has been enhanced with deeper functionality and a more visual approach with recommendations for data shaping, profiling and enhanced traceability. Tableau Prep transformation flows can be created either on the desktop or in the browser and may be scheduled and orchestrated on the server to operationalize data preparation tasks.
Tableau also continues to focus on improving and growing its self-service analytics platform into a modern enterprise-wide analytics platform. Governance functions such as data source certification and ML-powered data source recommendations have been incorporated. Moreover, with ‘Virtual Connections and Data Policies’, the vendor has started to centralize connection information and security.
Tableau also provides GenAI features to help end users. For data analysts, Tableau AI and Tableau Pulse automate tasks such as analysis, preparation and governance, offering guidance and contextual instructions. They streamline workflows, reduce technical barriers and minimize repetitive tasks. With generative AI, natural language calculations, chart suggestions and auto-generated data source descriptions are enabled. Additionally, Tableau now offers 20 accelerators, shared logins, data connectors, notifications and alerts in Slack as well as the Revenue Intelligence application to provide Salesforce customers with modern analytics. Data science scripts such as R and Python can be dynamically integrated into Tableau’s data prep and analysis features.
The vendor also actively prioritizes the expansion of its community. Tableau Exchange is a platform for partners to provide a growing catalog of offerings including dashboard extensions, connectors and accelerators (prebuilt dashboards).

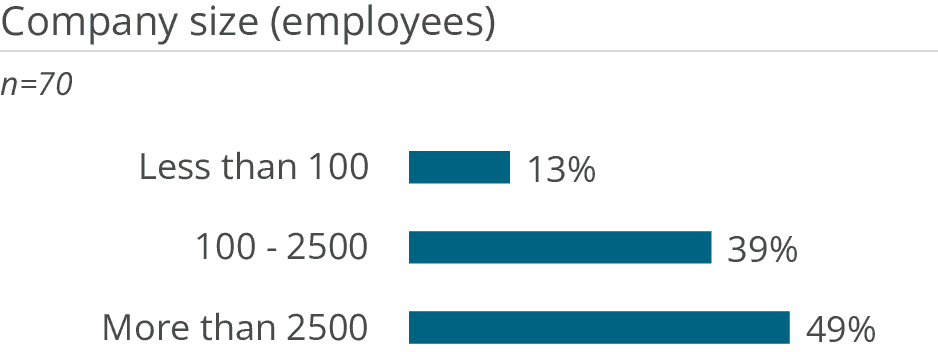
User & Use Cases
This This year we had 70 responses from Tableau users. At the time of the survey, 39 percent of them were using version 2022, 20 percent were using version 2023 and version 2021, 8 percent were using version 2020, 6 percent were using version 10, 4 percent were using version 2019 and 2 percent were running version 16, 13 and 9.
Want to see the whole picture?
BARC’s Vendor Performance Summary contains an overview of The BI Survey results based on feedback from Tableau users, accompanied by expert analyst commentary.
Contact us to purchase the Vendor Performance Summary- Register for a free sample Vendor Performance Summary download
- If you have any questions, feel free to contact us