Qlik, originally founded in 1993 in Lund, Sweden, moved its headquarters to the United States in 2005 after raising funds from several venture capital firms. QlikView, the company’s only product at the time, was very aggressively marketed after the VC investment. This created attention and traction, and in 2010 Qlik went public on NASDAQ. In 2016, Qlik was acquired by a private equity company and delisted from the stock exchange.
Qlik was a one-product company until the general availability of Qlik Sense in 2014. Today, the vendor provides a portfolio of data management and analytics offerings. With this stack, Qlik focuses on helping customers manage their data, providing analytics to analyze the data, and features to transport insights to end users.
Qlik Sense is a visual analysis and dashboarding product based on Qlik’s own in-memory technology. It is particularly suitable for interactive, visual and set-oriented analysis as well as dashboard and application design. In general, it addresses a mixture of use cases from self-service data visualization to building guided analytical apps to embedded analytics. It covers analysis, dashboard and report creation and is strongly focused on business analysts and casual business users.
Qlik’s platform consists of several components including Qlik Sense, Qlik Core for developers, QlikView and Qlik NPrinting, for enhanced printing and page-based layout. Qlik DataMarket is a marketplace for sourcing external data for analyses such as weather and currency information. In 2017 Qlik acquired Idevio, now called Qlik GeoAnalytics, to provide enhanced spatial analysis. The vendor has also strengthened its data management offering. Qlik Data Catalyst, formerly Podium Data, was acquired to broaden its feature set for data preparation and data catalogs. This was followed in 2019 by the acquisition of Attunity, a real-time data integration specialist.

User & Use Cases
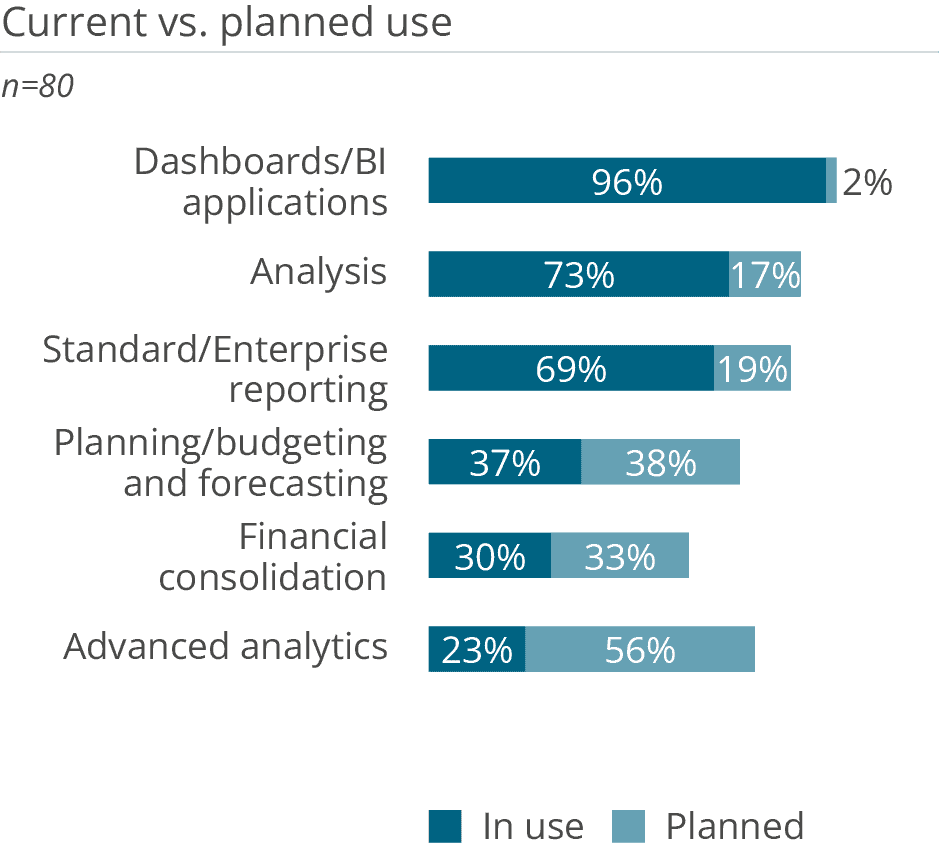
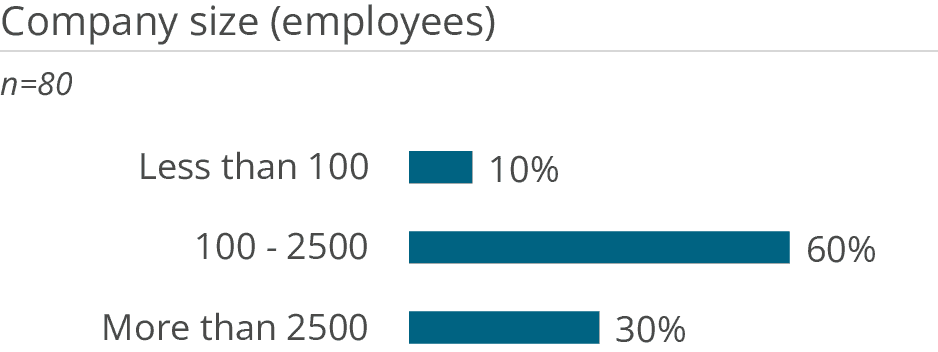
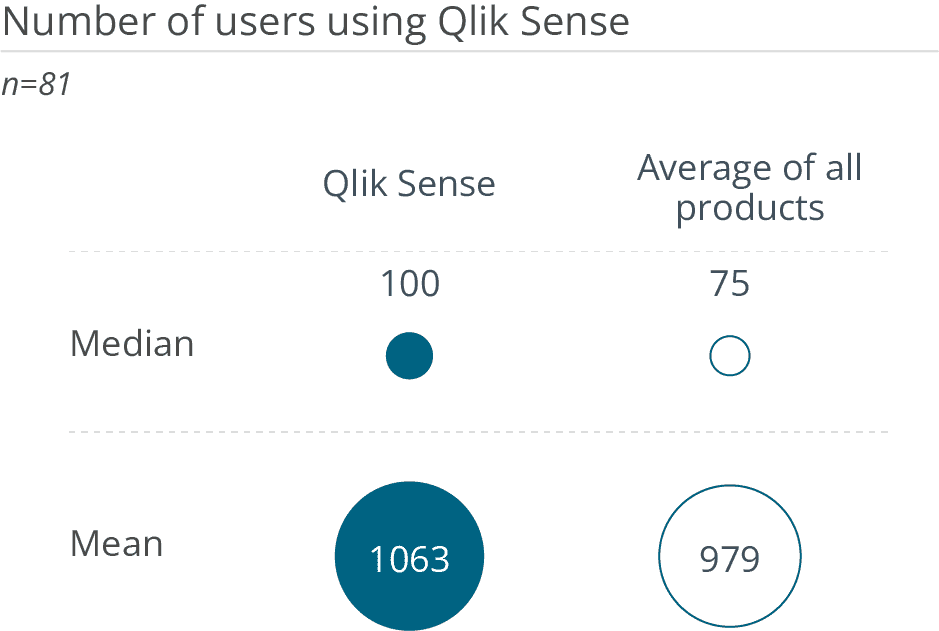
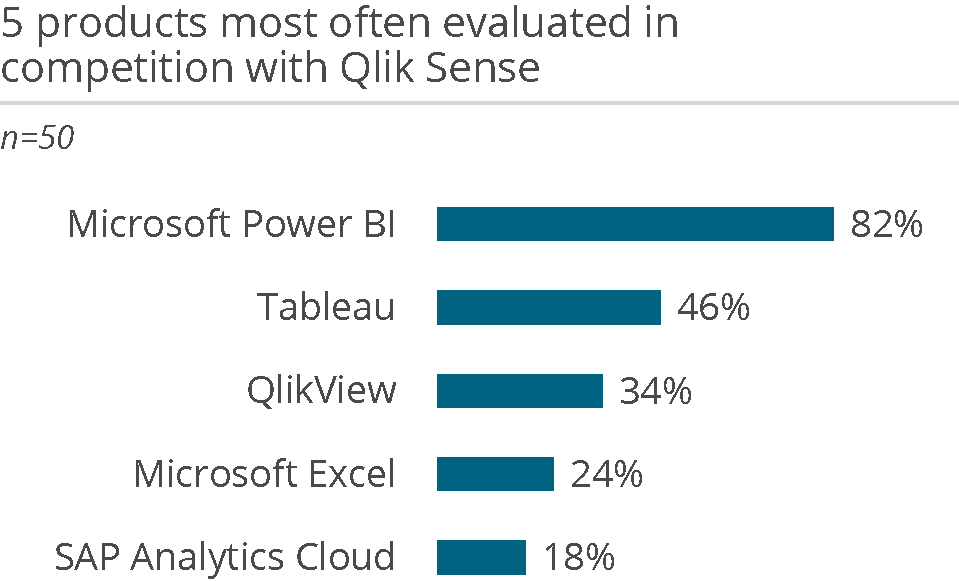
Qlik Sense is used quite broadly by customers. Most respondents (93 percent) use the software for its core strength: creating interactive dashboards. In addition, 87 percent of customers use it for enterprise reporting and 78 percent for ad hoc query. 74 percent of customers use the solution for analysis. Most users navigate and explore content provided by other users because only 45 percent claim to create reports with the software. 35 percent of users model and enrich data using Qlik Sense, which is slightly above the survey average of 32 percent. The solution’s characterization as a visual analysis solution geared to business users is also highlighted by the two most frequently evaluated competitors: Microsoft Power BI and Tableau. Roughly equal shares of the Qlik Sense users in this year’s survey came from mid-sized companies (45 percent) and large companies (46 percent). Qlik Sense has a mean of 1,161 users and a median of 101 users, both slightly above average.
Current vs. planned use
N=116

5 products most often evaluated in competition with Qlik Sense
N=115

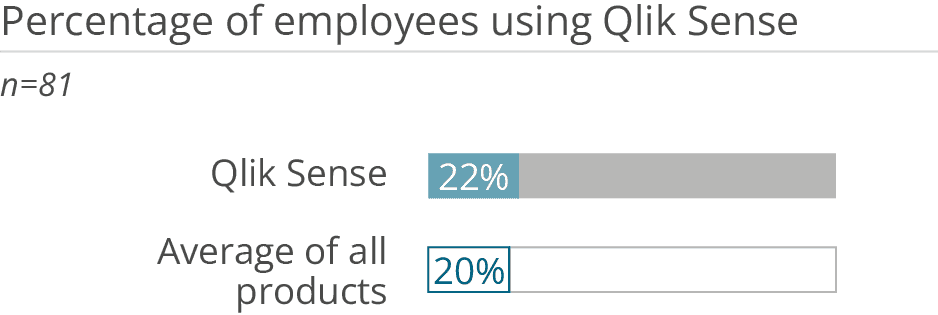
Percentage of employees using Qlik Sense
N=118

Number of users using Qlik Sense
N=118

Tasks carried out with Qlik Sense by business users
N=121

Company size (number of employees)
N=119


Summary of Qlik Sense highlights
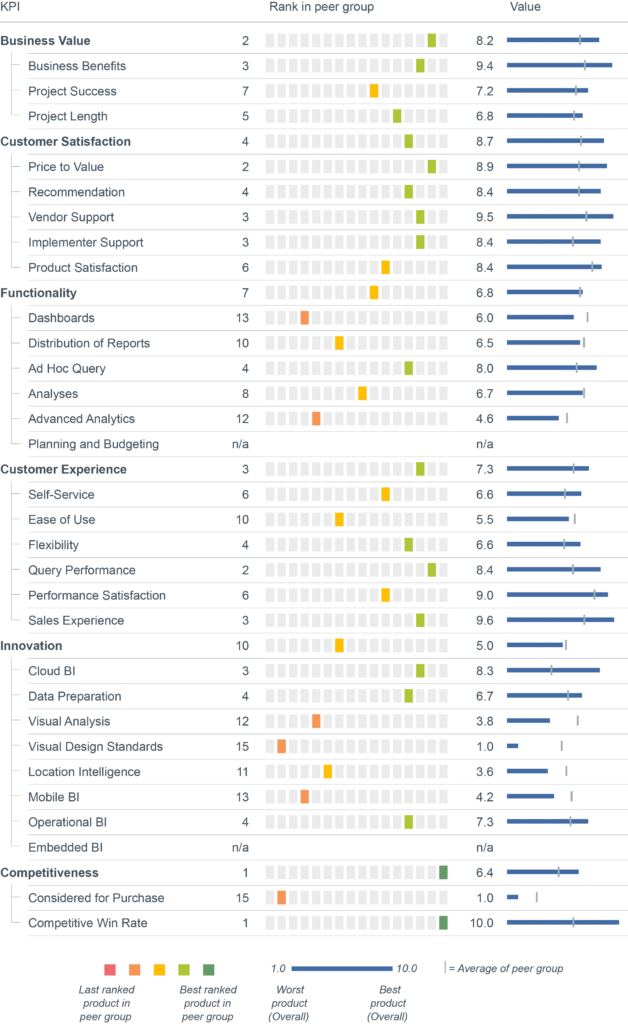
Qlik Sense has significantly improved on its already impressive results from last year’s BI Survey, earning 11 number one rankings and 44 leadership positions in its various peer groups.
Qlik Sense offers customers fast query performance and innovative features to implement leading edge use cases. The modern platform with its strong query engine shines in many areas. Qlik Sense’s ‘Analyses’ functions are top-ranked in two peer groups while it is also top-ranked in other functional areas such as ‘Dashboards’ and ‘Data Preparation’. This broad range of sophisticated capabilities is the foundation for exceptional results in categories such as ‘Business benefits’, ‘Business value’, ‘Product satisfaction’, ‘Recommendation’ and ‘Competitiveness’.
Business benefits – Top-ranked
Peer Group: Large international BI vendors

Business value – Top-ranked
Peer Group: Large international BI vendors

Customer experience – Top-ranked
Peer Group: Large international BI vendors

Product satisfaction – Top-ranked
Peer Group: Large international BI vendors

Recommendation – Top-ranked
Peer Group: Large international BI vendors

Want to see the whole picture?
BARC’s Vendor Performance Summary contains an overview of The BI Survey results based on feedback from Qlik Sense users, accompanied by expert analyst commentary.
Contact us to purchase the Vendor Performance Summary- Register for a free sample Vendor Performance Summary download
- If you have any questions, feel free to contact us