Introduction
Unclear use and understanding of the term business intelligence (BI) and analytics have made it difficult to grasp the scope of disciplines and software categories that fall within the realm of business intelligence tools. This article offers a pragmatic business intelligence and analytics definition and clarifies the topics business intelligence and analytics covers with insights into the relevant tool types.
To help improve your understanding of this complex subject, this article addresses the following points:
Business intelligence and analytics is a key element in a modern and successful business strategy. The right business intelligence tools enable companies to retrieve more relevant data, gain better insights, enhance the decision-making process and therefore create a competitive advantage.
Business intelligence applications specifically cover the collection, processing and provision of data for controlling, managing and planning corporate performance. To help define business intelligence, it is necessary to understand at what steps of managing decisions it comes in. The visualization below shows the management cycle and the core of traditional business intelligence steps that will be elaborated upon in this article.
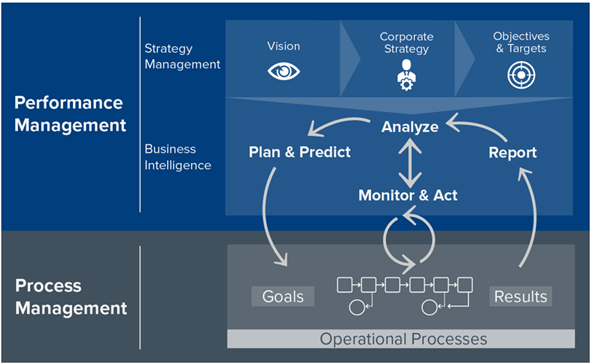
Figure 1: Business intelligence offers functions to support the management cycle in organizations
To realize the strategic direction of an enterprise, different business intelligence tools offer functionality for reporting, dashboarding and analysis as well as planning, budgeting and simulation.
Business intelligence and analytics span a range of application types
All BI solutions help to generate, prepare, display and deliver decision-relevant information to users. The level of skills required to use an application and the degree of flexibility for the user vary between the differet types of business intelligence tools. Figure 2 displays typical BI application types along these two dimensions.
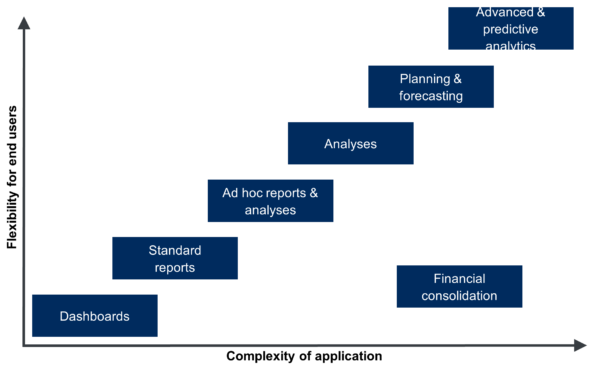
Figure 2: Overview of typical functional areas of business intelligence software tools
Dashboards and analytical applications
Dashboards and analytical applications provide a quick overview of what is going on in the enterprise. They are typically characterized by a high level of aggregation of key figures that allow the user to monitor the performance of the business or its main areas at a glance.
In terms of presentation, this format favors a dynamic overview and shows KPIs in easy-to-understand graphics. For the user, the benefit comes from this easily digestible format from which a broad understanding of how the business is doing with regard to the relevant KPIs can be gained. The interface usually comes with basic drill, search and filter functionality that guides the viewer through their analyses, what they are seeing and how these numbers came about.
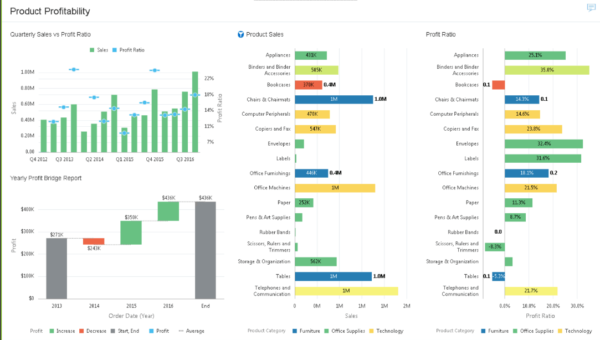
Figure 3: Example of a simple and graphics-focused dashboard
The simplicity and accessibility for all levels of knowledge and data literacy make this type of application a popular choice for monitoring important business processes. While dashboards and, for the same reason, standard reports used to be built by dedicated experts, business users increasingly build them in a self-service manner powered by increasingly powerful and easy-to-use tools.
Standard reports
Like dashboards, standard or formatted reports inform the reader about the status of the enterprise with the help of specific KPIs. The difference lies in how the information is communicated and its density. Standard reports present information in a predefined format, making it easy to compare results over time. They often contain detailed information that does not fit the one-screen approach of dashboards.
Additionally, reports are typically page-oriented and often compiled into report books. They can be distributed based on events or schedules or they may be retrieved on demand. Standard reports are supplied in numerous ways: through interactive portals, via mobile devices or email as PDF, Excel or other formats.
The interaction level for the recipients depends on the nature of the report (type) as they can be static or dynamic. Static reports are often used to conveniently distribute information to many users who may not even have direct access to the BI tool. Dynamic reports allow filtering and aggregations that give users greater control to focus on their distinct information needs.
In principle, reporting tools are a popular choice to satisfy consistent and recurring information needs. As such, they still comprise the backbone of information distribution in many organizations as laid out in the recent BARC study on “The Future of Reporting”.
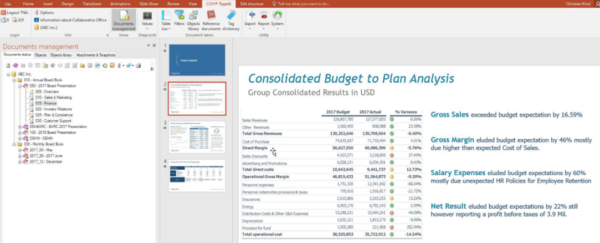
Figure 4: Example interface for a digital report
Ad hoc reports and analyses
While recurring and predictable information needs are sufficiently covered by standard reports and dashboards, there are situations that warrant a specific investigation and interest. For this, ad hoc reports and analyses play a critical role. In a nutshell, they are created by business users to quickly gather required information instead of providing it in a highly formatted and standardized way – here speed trumps perfection.
The flexibility of the queries fired is facilitated by a well-defined and curated semantic layer that shields users from underlying technology and offers the available objects in an accessible form. Such an abstraction layer is vital for ad hoc reporting tools to remain easy to use and is key in helping users combine data efficiently. Ad hoc reports typically allow one query per report and offer limited formatting options to speed up content creation.
Querying data becomes more accessible through natural language queries (NLQ) where the user can ask questions in natural language that are then translated into queries.
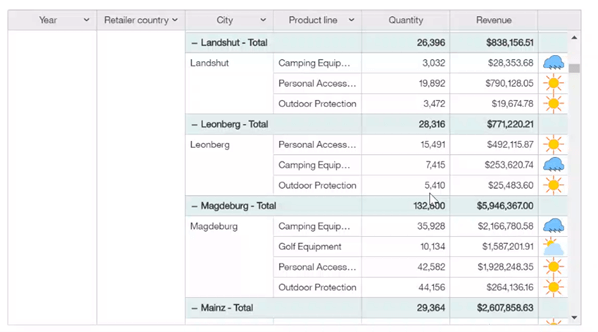
Figure 5: Example of an ad hoc analysis in a tool
Want to rate your BI and analytics software?
Share your experience in the world‘s largest and most comprehensive survey of BI software users
Take part in The BI & Analytics Survey
Analyses
In comparison to ad hoc reports, analysis tools provide a more flexible and direct interaction with data and access to the data model. The goal is to generate insights by detecting patterns, deviations or clusters.
In that sense, analysis here describes the flexible navigation within data to answer urgent business questions. Popular types of analysis fall into three categories: dimensional (OLAP), visual and set-oriented analysis. The most popular ones among them are dimensional (OLAP) and visual analysis.
Dimensional analysis allows business users to quickly retrieve results from highly structured sources (cubes) without requiring deep technical expertise. Stable data models, which are common in finance or planning, are an ideal fit for that technology.
Visual analysis leverages the capacity of the human brain to spot patterns and trends quickly. Typically, visual analysis is a good choice for analyzing data with changing structure and multiple attributes such as customer data, not least because the data preparation features are often bundled in the relevant tools.
The increasing ease of use driven by augmented analytics used to guide analyses makes analyzing data simpler and yet more powerful (e.g., by making more complicated statistical methods available to business users or pointing them to abnormalities they were not even looking for). Therefore, more and more users rely on leading-edge tools to support management decisions with new insights.
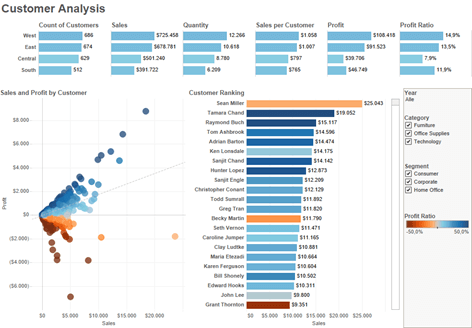
Figure 6: Example of an analysis user interface
Advanced and predictive analytics
Advanced analytics describes the analysis of data with the help of statistical algorithms to identify clusters, patterns and trends. The goal is typically to predict future events such as the odds of converting an occasional to a regular buyer and finding the most efficient way to do so.
The term advanced analytics encompasses methods of data mining, predictive analytics, machine learning as well as operations research. All are used to gain detailed and accurate knowledge about the data interrogated and its meaning to the business.
Advanced analytics tools often include data preparation functions to support the efficient and tailored flow of data to the analytical models. They also make intensive use of popular libraries (e.g., for machine learning or deep learning). The scope of advanced and predictive analytics goes beyond decision support, which offers distinct challenges to embed and operationalize the models created.
Advanced analytics tools are popular for highly specialized and hypothesis-free research and are therefore primarily used by data scientists. But again, driven by augmented analytics, a more guided approach to advanced analytics is becoming more popular, making it readily available even to more casual users or making data scientists more productive by automating mundane tasks with AutoML.
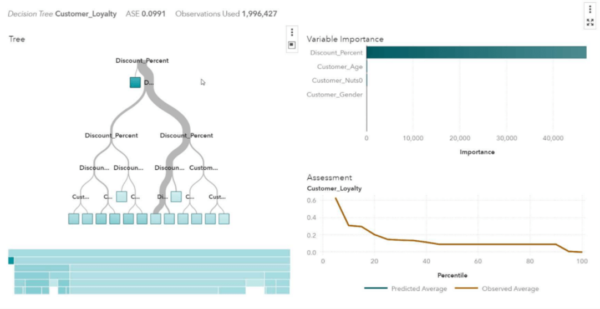
Figure 7: Example of the user interface of an advanced analytics tool
Planning, forecasts and simulations
While analysis focuses on revealing information to help business decisions, planning supports a different part of corporate management. In a business context, planning refers to establishing goals that align with a company’s strategy and vision.
Planning software provides functions for creating planning models that are the basis for capturing consistent planning data and integrating results from detailed plans. They offer planning sheets for data entry and workflow functions to manage and align the planning process.
Forecasts are created by combining actual data with (adjusted) planning figures to determine the impact of recent events on the “bottom line”. Simulations, another key capability of planning tools, are calculated to evaluate the impact of uncertain events. Both simulations and forecasts are supported by modern planning tools. Planning tools are essential to efficiently handle the planning process and can be found in most companies these days.
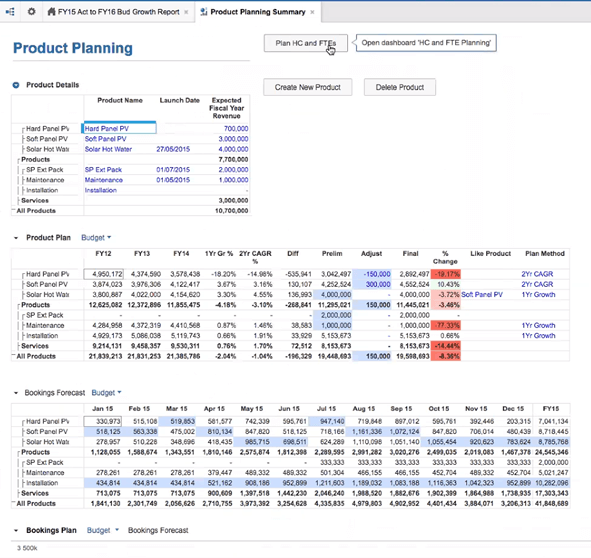
Figure 8: Example of a planning mask in a planning solution
Financial consolidation
Finally, let’s turn to the outlier in this group: Legal or financial consolidation. Consolidation leverages a plethora of analytics and BI capabilities such as OLAP analysis or reporting combined with a reliable calculation engine. Additionally, before following legal requirements, a consolidated group view is indispensable for deciding on the strategic course of large corporate amalgamations.
Consolidation solutions offer functions for reconciling the results of connected legal entities into group results and carrying out the distinct steps required to create legal consolidated financial statements following strict rules to comply with internal and external audits alike. This includes the collection of basic data of all affected legal entities, reconciling intercompany postings and reporting results in financial statements. These tools are therefore popular among enterprises who must provide consolidated financial statements for owners and authorities.
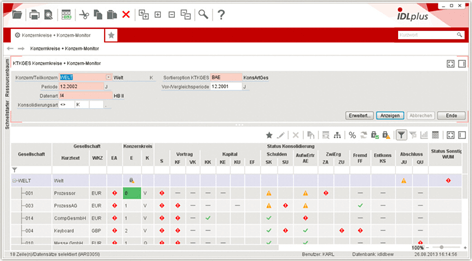
Figure 9: Example of a consolidation tool
Summary
Business intelligence and therefore business intelligence tools cover a constantly growing range of scenarios. The ultimate goal of BI is to continuously monitor business performance to ensure that an enterprise stays on track to achieve its strategic goals. If need be, it allows decision-makers to carry out course corrections.
BI software is differentiated by the level of flexibility it gives users to interact with data or by how it helps to provide insights into new business questions or monitor ongoing processes.
As the market for BI tools is steadily growing, keeping up with the latest developments and navigating the jungle of marketing slogans has become difficult. In one of our next posts, we will cut through the thicket to help you understand the impact and potential of augmented analytics to get more out of your data treasures.