QlikView
Qlik, originally founded in 1993 in Lund, Sweden, moved its headquarters to the United States in 2005 after raising funds from several venture capital firms. It is currently owned by the private equity company Thoma Bravo after its acquisition in 2016. Since then, the vendor has made a number of acquisitions to create a robust cloud platform that delivers the data integration and analytics organizations need to transform raw data into informed action.
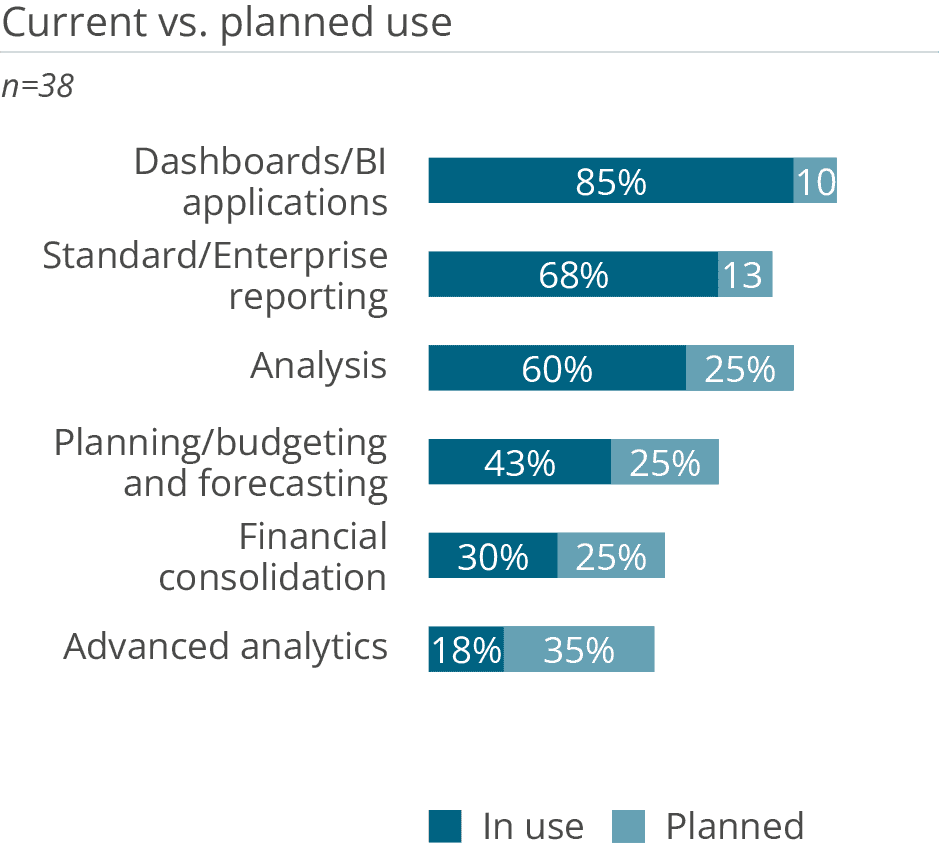
QlikView was the vendor’s first analytics product and the tool it became famous with. It is a dashboard and analysis product that made in-memory technology in analytics and BI widely popular. The QIX engine still delivers exceptional performance for highly responsive analyses and interactive dashboards. QlikView was the first tool marketed under the ‘data discovery’ and ‘modern BI’ terms to differentiate it from established BI suites. It was positioned as a self-service tool targeted at business users, enabling them to analyze data without having to consult developers for new reports, dashboards or analyses on new data sets.
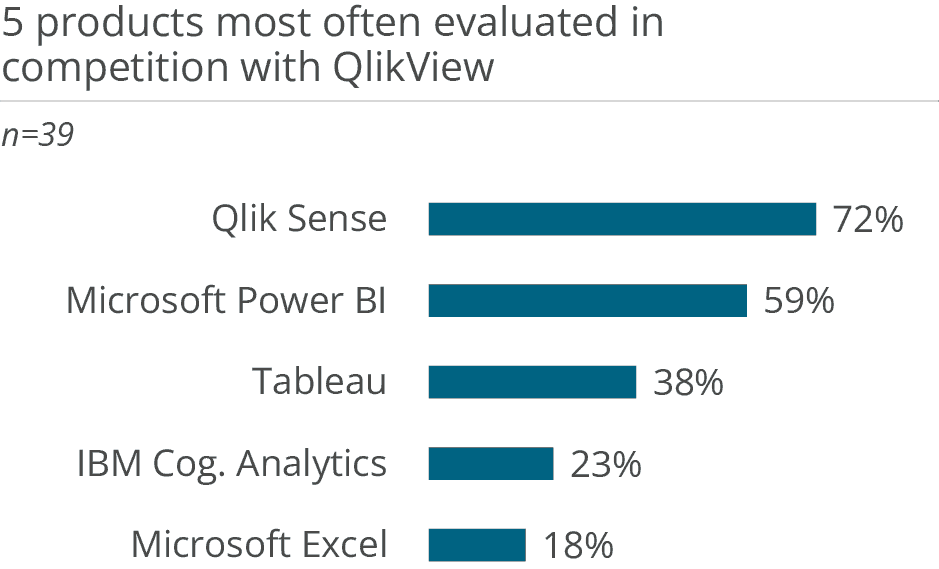
QlikView is still in use at many organizations but no longer actively marketed to new customers. To ensure compatibility, at least one QlikView release per year is provided with improvements ranging from technical health to integration in the Qlik portfolio. QlikView applications can be run in Qlik Sense, which makes migrations much easier, especially when dealing with large implementations.
QlikView was originally developed as a desktop solution with a Windows client (QlikView Desktop). It can still be used in this way, and often is, but Qlik has moved away from the desktop to a web-based architecture (QlikView Server). QlikView Desktop is used for data preparation (extract, transform, load) as well as for building applications. A core strength of QlikView Desktop is that it seamlessly combines content consumption and creation in a single mode. This makes the software very flexible to analyze data, and enrich and reshape it for further inquiries. QlikView applications (‘apps’) can be hosted on the web as guided apps (e.g., dashboards or analytical applications) or delivered as complete apps with the data to users who use the local client to access server-based apps.
The QlikView Publisher component is used to handle data reloads and the distribution of QlikView apps to users. Qlik NPrinting (a separately licensed product) provides centralized report creation and distribution using data and visualizations from QlikView.

User & Use Cases
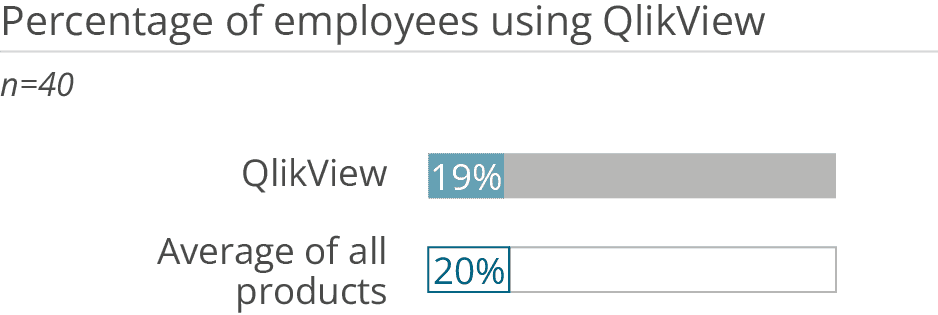
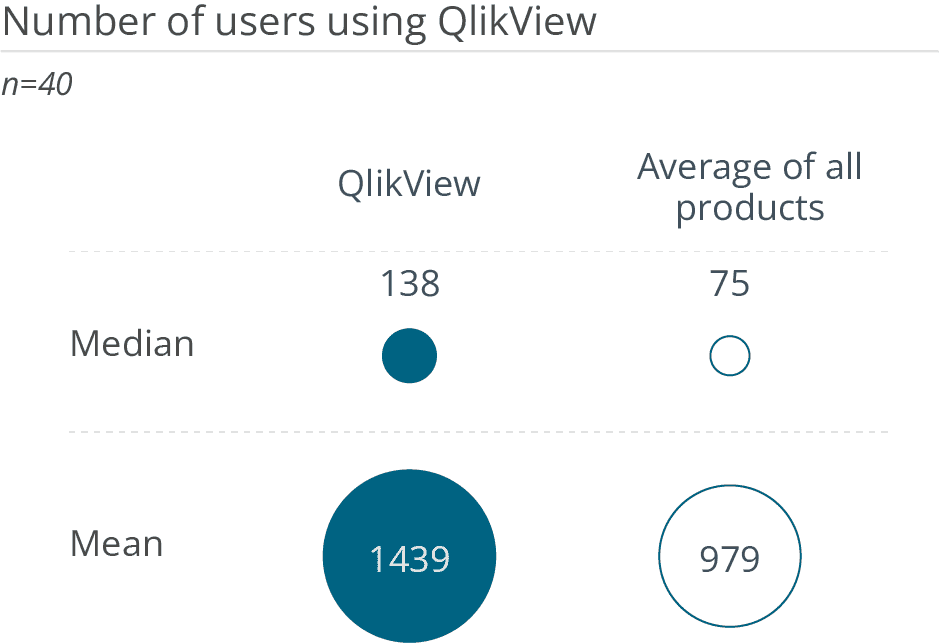
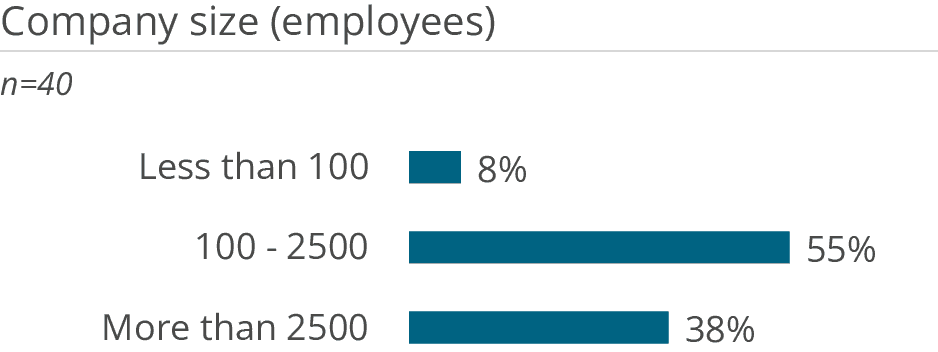
This year we had 40 responses from QlikView users. At the time of the survey, 91 percent of them were using version 12 and 9 percent were running version 11.
Want to see the whole picture?
BARC’s Vendor Performance Summary contains an overview of The BI Survey results based on feedback from QlikView users, accompanied by expert analyst commentary.
Contact us to purchase the Vendor Performance Summary- Register for a free sample Vendor Performance Summary download
- If you have any questions, feel free to contact us