Microsoft Excel
Microsoft, the world’s largest software company, was founded in 1975 and has become a household name primarily due to its Windows operating system and Office suite. The vendor has a broad enterprise offering too, ranging from cloud services (Azure) to database to ERP products.
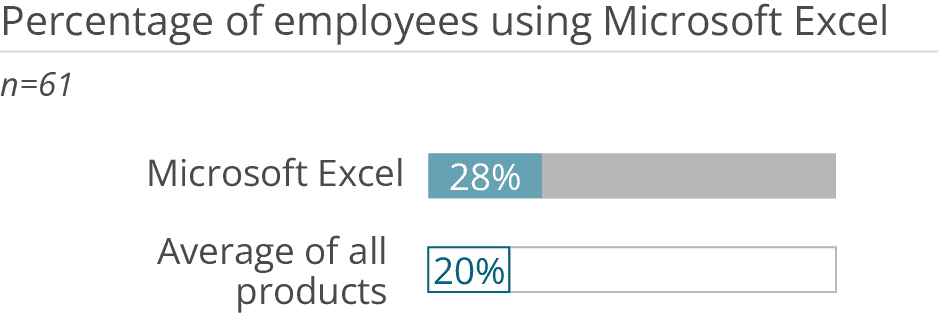
Customer feedback clearly shows that Excel is a commodity software in enterprises. It is used on average by 28 percent of employees compared to The BI & Analytics Survey 24 average of 20 percent. Good availability of skilled users is cited as one of the main attractions of Excel, underlining the widespread knowledge of this product.
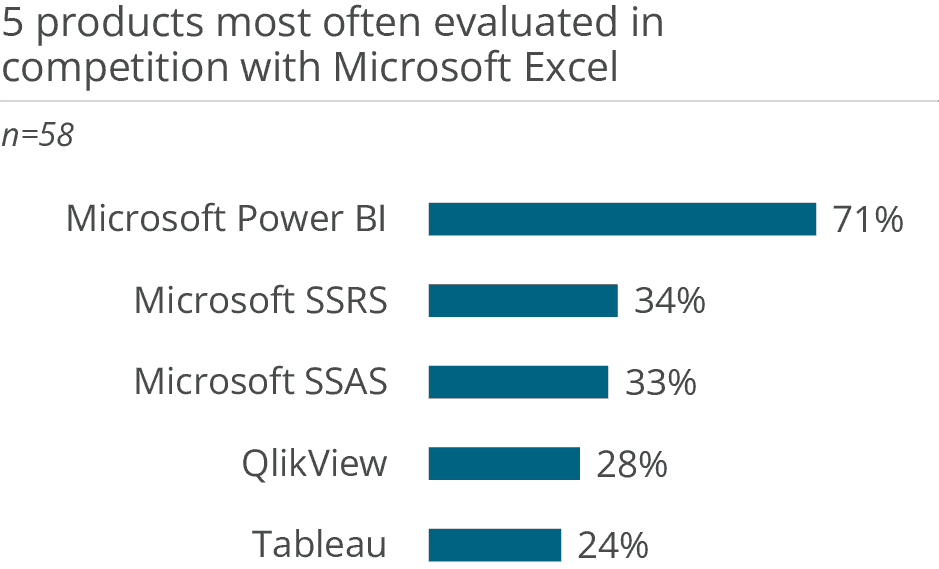
Excel is mostly evaluated in comparison with other Microsoft products. Here, Power BI clearly leads with 71 percent, ahead of the two services from SQL Server (Reporting Services and Analysis Services), which are used to generate standard reports. Excel is compared with QlikView and Tableau much less frequently.
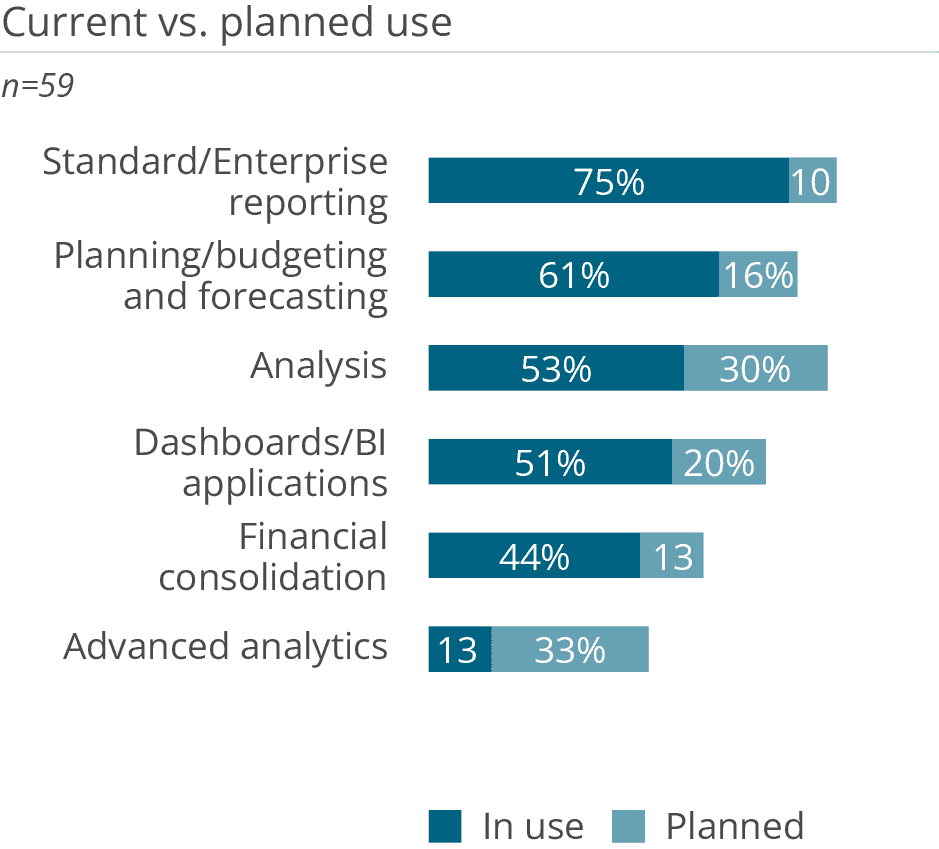
61 percent of respondents claim to use Excel for planning. This is interesting as there are no specialized planning functions, such as workflow management and versioning, or functionality for the handling of new planning elements. But, as always, Excel is available and you can do almost anything with it – even if only 9 percent said that its coverage of BI/analytics-specific requirements was one of the main reasons why they decided to buy the product, versus an average of 31 percent for all products in this survey.

User & Use Cases
Customer feedback clearly shows that Excel is a commodity software in enterprises. It is used on average by 28 percent of employees compared to The BI & Analytics Survey 24 average of 20 percent. Good availability of skilled users is cited as one of the main attractions of Excel, underlining the widespread knowledge of this product.
Excel is mostly evaluated in comparison with other Microsoft products. Here, Power BI clearly leads with 71 percent, ahead of the two services from SQL Server (Reporting Services and Analysis Services), which are used to generate standard reports. Excel is compared with QlikView and Tableau much less frequently.
61 percent of respondents claim to use Excel for planning. This is interesting as there are no specialized planning functions, such as workflow management and versioning, or functionality for the handling of new planning elements. But, as always, Excel is available and you can do almost anything with it – even if only 9 percent said that its coverage of BI/analytics-specific requirements was one of the main reasons why they decided to buy the product, versus an average of 31 percent for all products in this survey.
Want to see the whole picture?
BARC’s Vendor Performance Summary contains an overview of The BI Survey results based on feedback from Microsoft Excel users, accompanied by expert analyst commentary.
Contact us to purchase the Vendor Performance Summary- Register for a free sample Vendor Performance Summary download
- If you have any questions, feel free to contact us