Looker
[The BI & Analytics Survey 23 results, not included in The BI & Analytics Survey 24] Google (a subsidiary of Alphabet) is mostly known for its search engine and associated offerings. However, with its Google Cloud Platform, the vendor has entered the BI and analytics market with attractive data management and analytics products. To complement its self-developed data management and analytics solutions, the vendor acquired Looker in 2020. Looker was founded in 2012 in Santa Cruz, CA, and has grown quite quickly since then. About 2,000 companies now use Looker.
Looker is the main enterprise BI and analytics platform from Google. This web-based platform is focused on providing a governed, standardized and trusted view of business data. As a result, Looker has designed a product that relies strongly on a central semantic layer created using LookML, its proprietary data description language (abstraction layer on top of SQL). Business users connect to data via this semantic layer, allowing them to do ad hoc analyses via a point-and-click interface. To underline its core strength and emphasis on data, Google has started to position Looker as a unified platform that powers data experiences and delivers actionable insights to employees at the point of decision.
Looker is particularly strong in embedded BI and connecting interactive visualizations into dashboard applications. Google’s goal for Looker is that it should help to integrate data into the daily workflows of users and allow organizations to extract greater value from it.
Looker Studio (formerly known as Google Data Studio) is a free cloud-based visualization product that focuses on querying 500+ data sources and presenting the insights revealed. Recently, Google announced plans to integrate Looker and Looker Studio. As a first step (currently in beta), Looker Studio can now access Looker’s semantic model to complement it for better self-service content creation.
Google Cloud Platform offers various additional options and services, amongst others for advanced analytics. Besides using incorporated functions and partner solutions in its BI and analytics products, users can leverage cloud services, for example, to process speech to text or for sentiment analysis.

User & Use Cases
Most of the Looker customers responding to this survey came from the IT industry (including gaming). These are mainly mid-sized companies (67 percent) with a median of 300 employees and a mean of 2,730. 63 percent came from Europe (including 37 percent from Southern Europe, 21 percent from DACH, 16 percent from UK and the remainder spread across France, Northern Europe and BeNeLux). 20 percent also came from North America, 10 percent from APAC and the rest from South America.
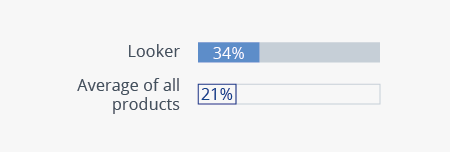
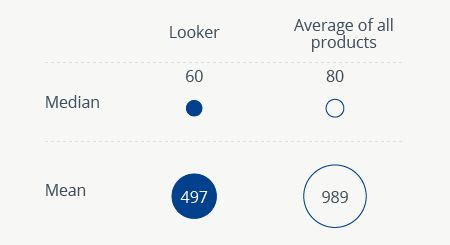
The median number of Looker users per company is 60 and the mean is 497. The product is mostly used in management (87 percent) as well as in marketing and sales (both 77 percent). An eyecatching median of 34 percent of employees use Looker. This is way above average and shows that it is widely used across multiple departments.
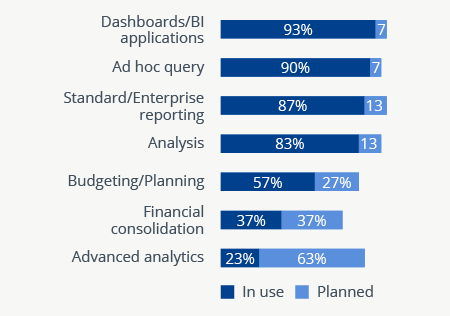
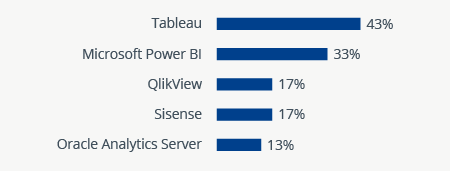
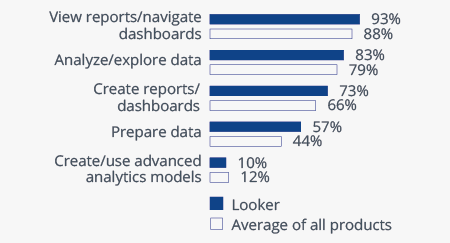
Although Looker is a rather focused BI and analytics platform, its usage scenarios are surprisingly broad. Over 90 percent have used the solution for its main purpose: creating ad hoc queries and visualizing data using dashboards. However, over 80 percent have created reports and used the product for analyses. The latter might be a slow transition from ad hoc query or it could be down to the interpretation of the term ‘analyses’ because Looker clearly has some limitations in this area. Another surprise is the list of Looker’s main competitors (as named by customers). These products are not comparable in all BI and analytics use cases.
Current vs. planned use
n=30
5 products most often evaluated in competition with Looker
n=30
Percentage of employees using Looker
n=30
Number of users using Looker
n=30
Tasks carried out with Looker by business users
n=30
Company size (number of employees)
n=30

Want to see the whole picture?
BARC’s Vendor Performance Summary contains an overview of The BI Survey results based on feedback from Looker users, accompanied by expert analyst commentary.
Contact us to purchase the Vendor Performance Summary- Register for a free sample Vendor Performance Summary download
- If you have any questions, feel free to contact us