Founded in 2009, Pyramid Analytics is a privately held software company with more than 200 employees. The company is headquartered in the Netherlands and has offices in the United States, Israel and the United Kingdom. It continues to grow and now supports more than 1,000 customers.
Pyramid Analytics launched its first BI product, BI Office, back in 2012. In 2017, the company introduced Pyramid Decision Intelligence Platform (Pyramid), a newly architected and revamped product to help customers make faster and more intelligent business decisions by automating the decision-making process.
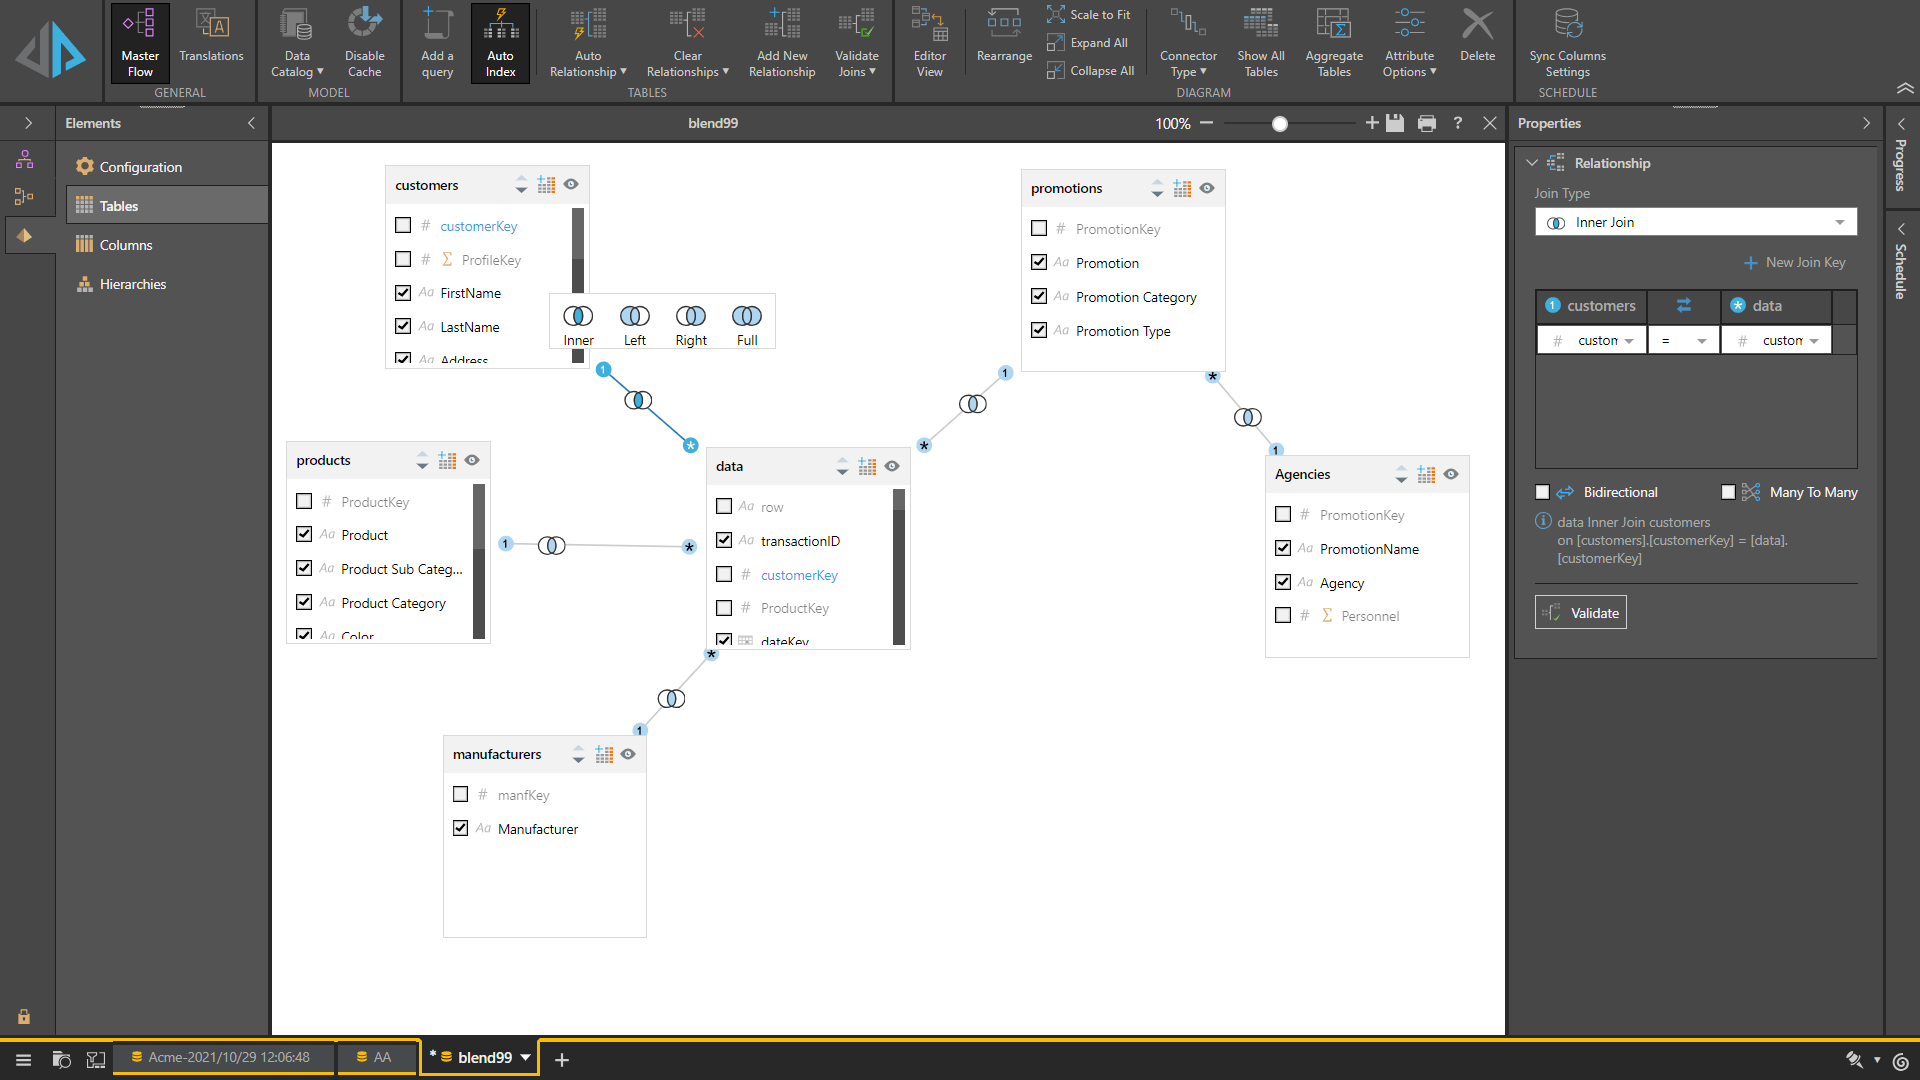
Pyramid combines components for data preparation, reporting, dashboards, machine learning and advanced analytics into a unified enterprise BI & analytics platform. It was designed from inception to bridge the gap between self-service and IT-driven BI & analytics, providing agility for decentralized business users while retaining centralized monitoring and control. This fosters enterprise-wide collaboration through the sharing of business logic and content.
The vendor puts an emphasis on Pyramid as an open and agnostic web-based platform. Its open architecture means the software can be deployed in different environments: cloud, hybrid or on-premises. Moreover, Pyramid is device and operating system agnostic with full gesture support on touchscreen and mobile devices. Through this versatility, customers can use the product to transform their existing and traditional on-premises businesses to modern cloud-based deployments.
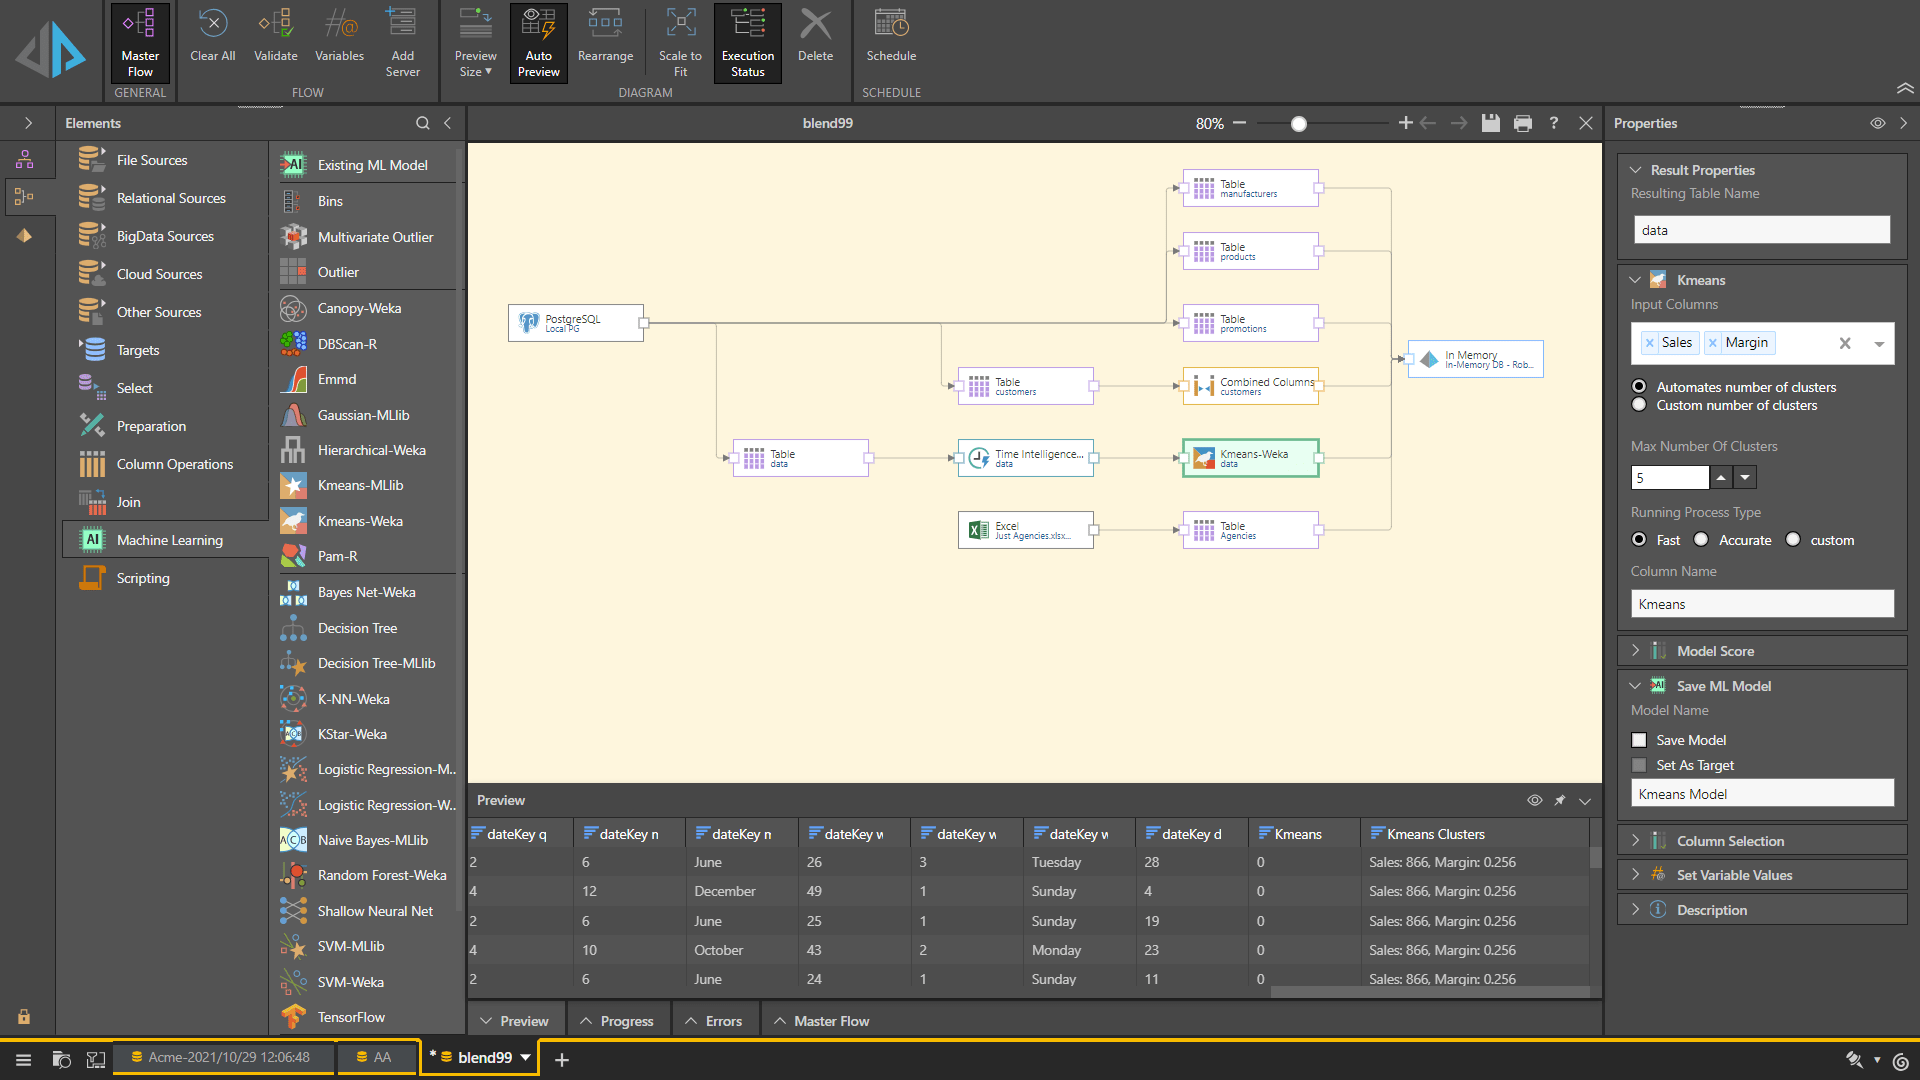
Pyramid also supports REST API to cater for scenarios such as embedding and automation. Its analytics engine, ‘PYRANA’, drives both querying and analytic calculations across different data sources using ANSI SQL or MDX – which enables fast in-place analytics on large data sets. This extends direct analysis to numerous relational, in-memory, cloud data warehouses and unstructured data sources natively – including Pyramid’s own proprietary in-memory engine. Pyramid also offers certified support to various SAP data sources, making it a viable alternative to leverage data from, for example, BW/4HANA without duplicating it. Data preparation and modeling features to support data integration and processing are incorporated into the product. For ML and AI, the vendor relies on R, Python, MLib, Weka and TensorFlow integrations. Besides connecting and querying data, the vendor also supports write-back to selected relational data sources.
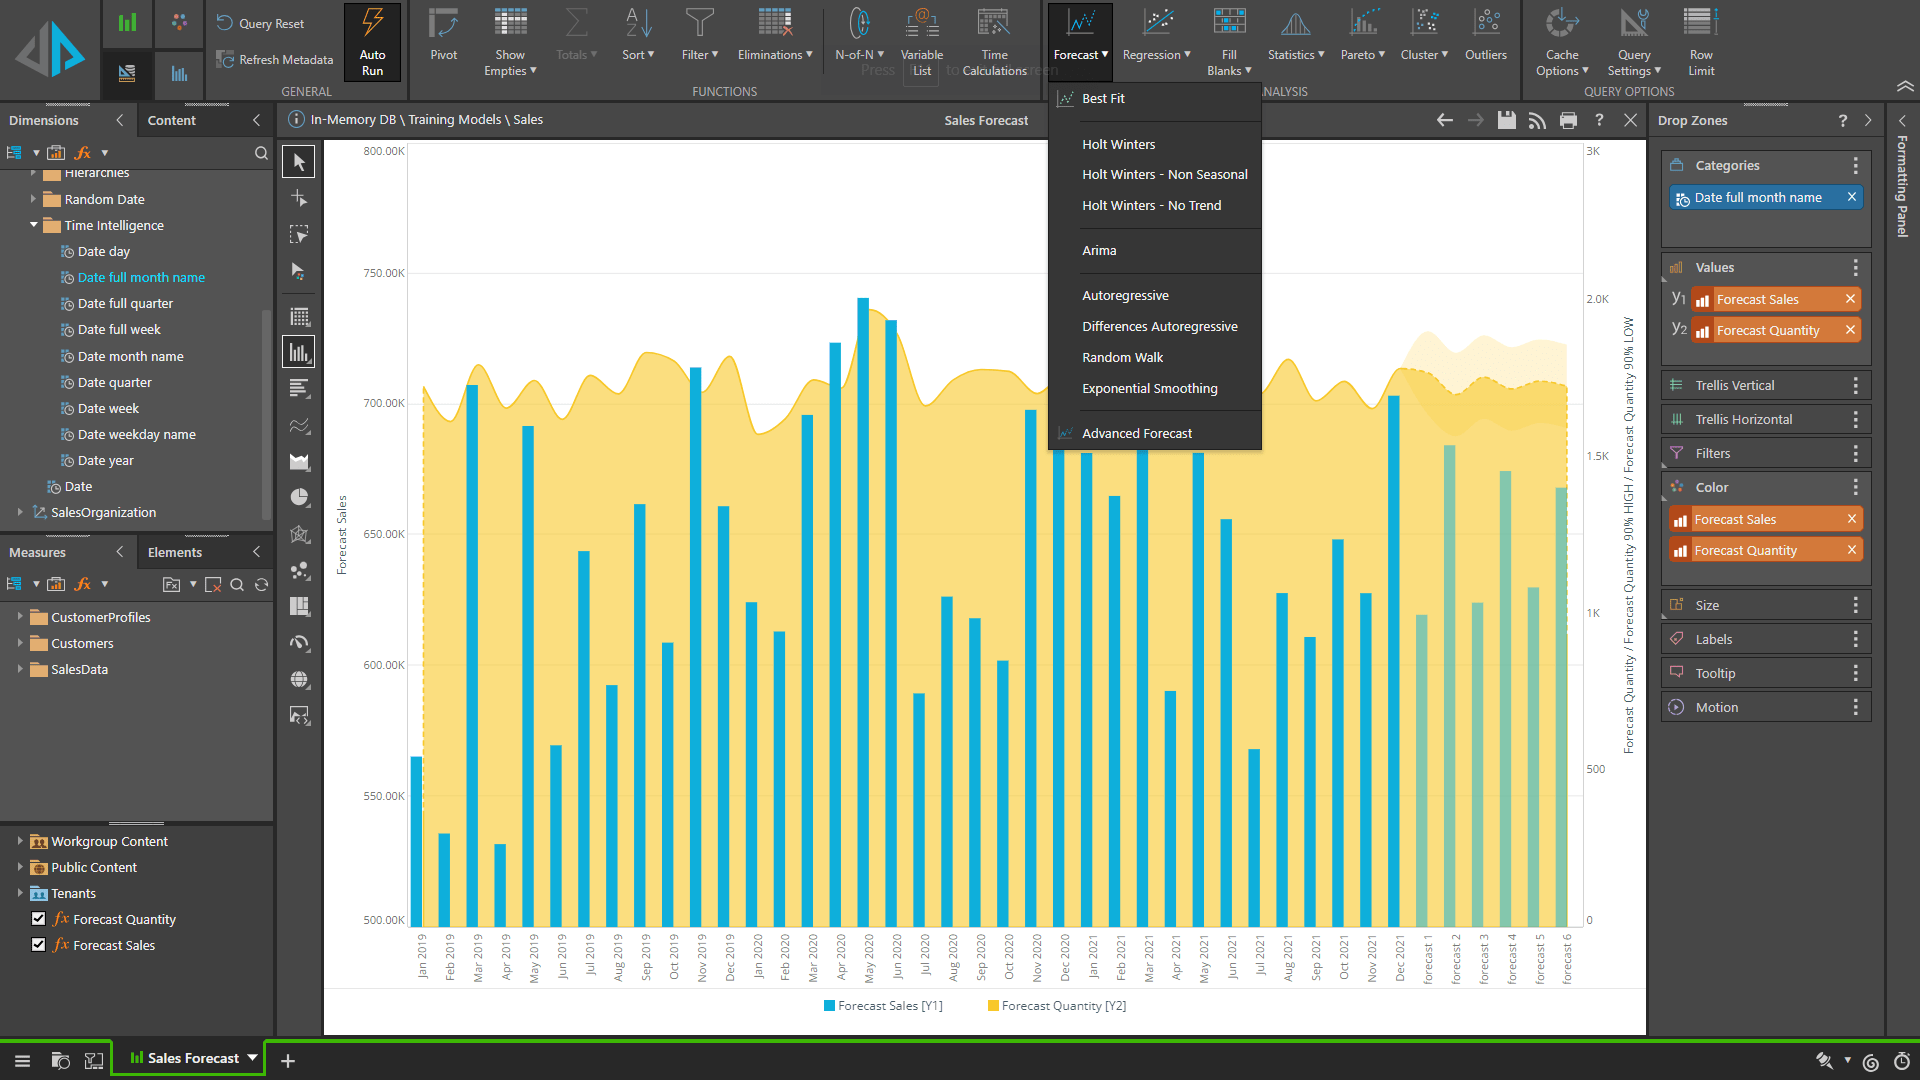
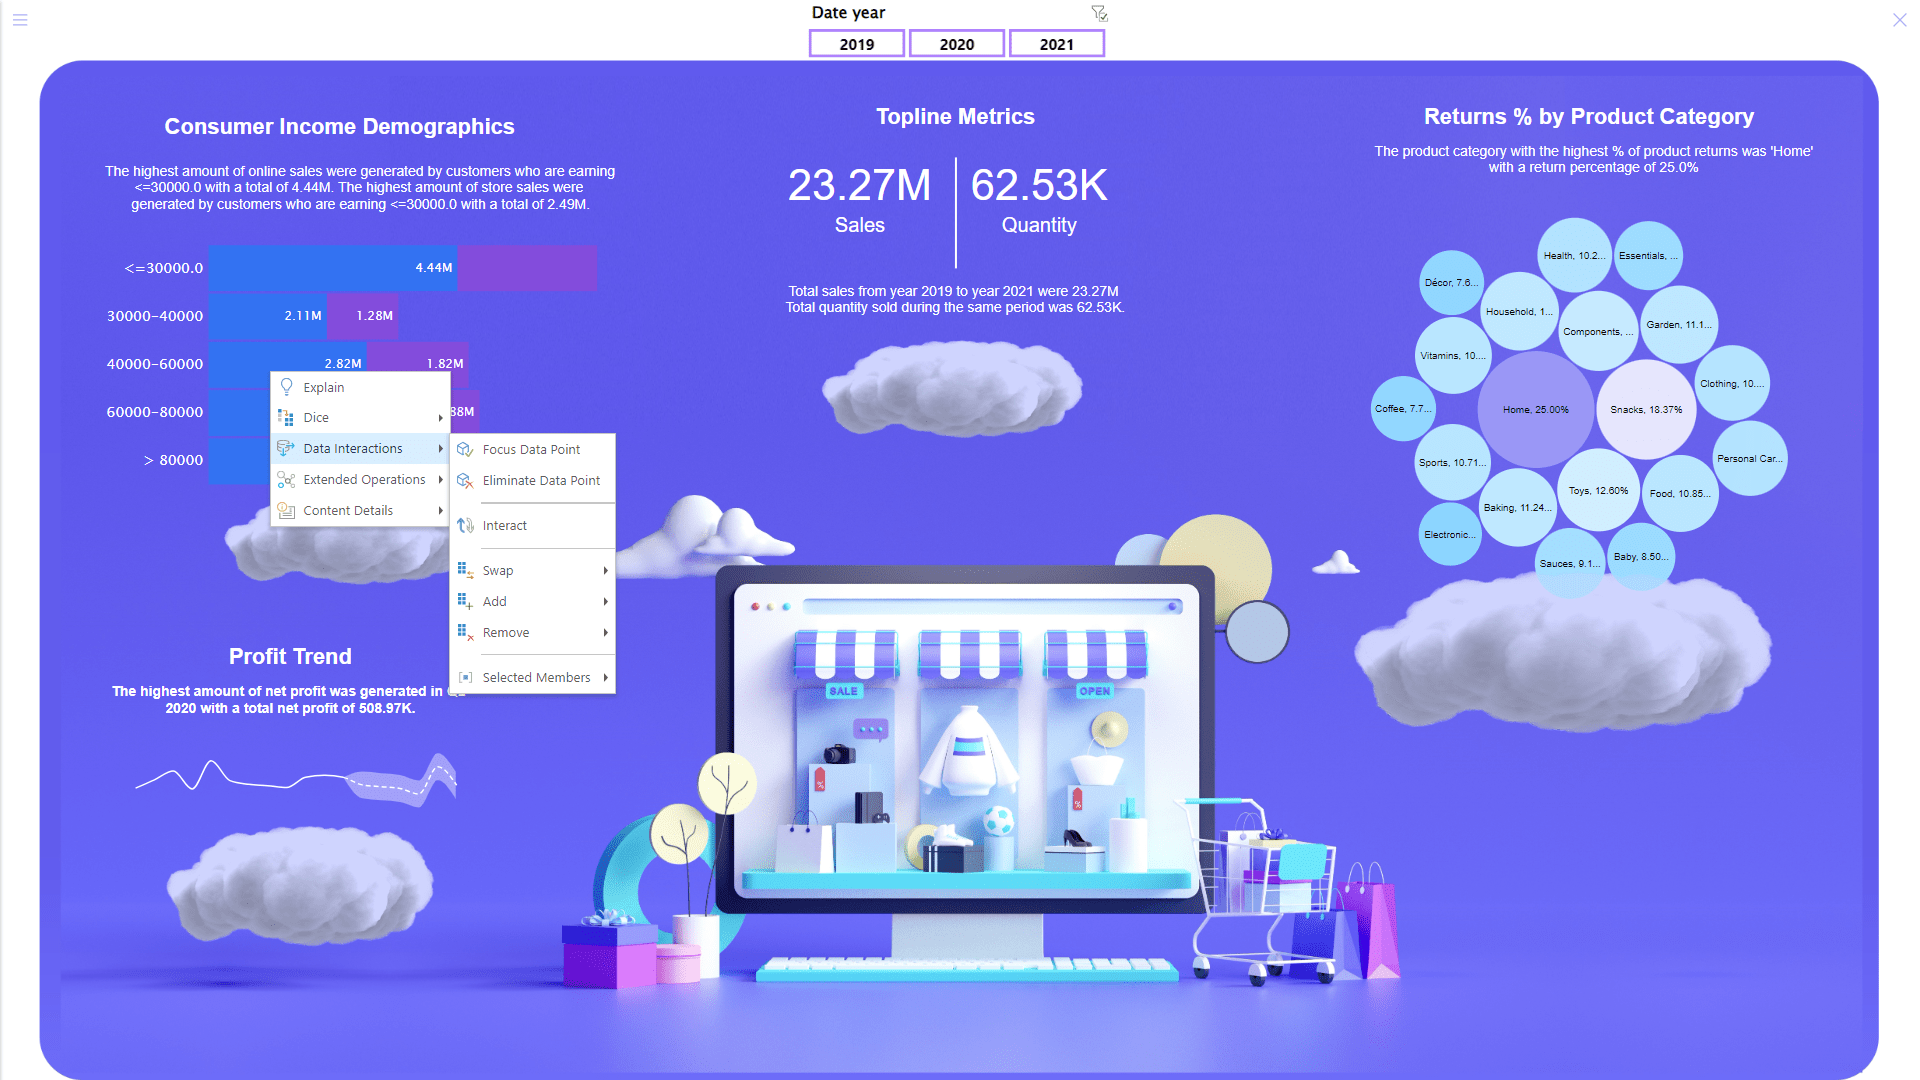
The vendor pursues its own approach when investing in NLQ capabilities with the goal of offering fast search-based analytics on all data sources without indexing all the data upfront. Automated insights (‘Smart Insights’) leverage NLG to explain basic facts, relationships, forecasts and other findings when applied to visuals or query results.
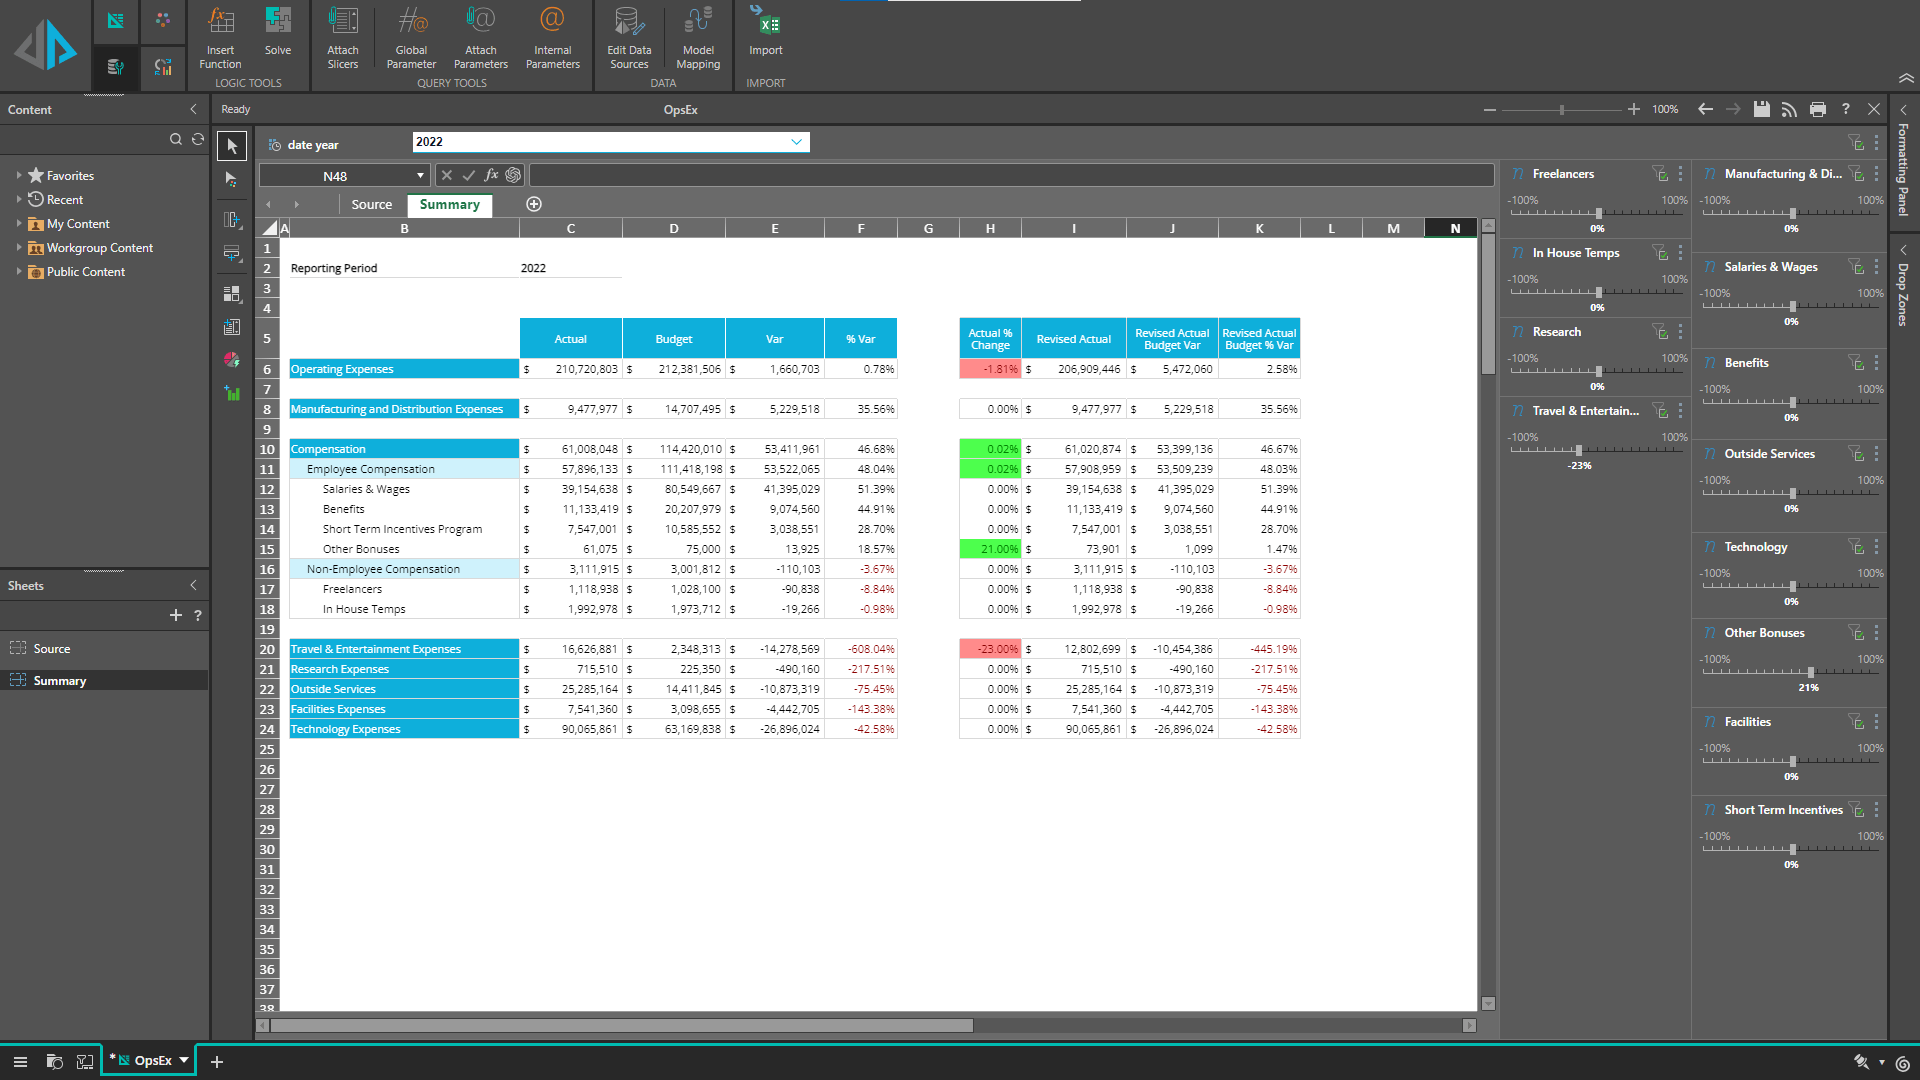
Recent developments include the new Tabulate and Solve modules. Tabulate is a browser-based spreadsheet environment which resembles Microsoft Excel. It offers business analysts well-known Excel formulas and granular formatting options. The module stores its objects, similar to other Pyramid objects, centrally and does not produce single file structures as its prominent competitor does. Solve is an optimization engine, incorporated into the Tabulate environment, which can be used for decision modeling and to solve optimization problems. The insights users gain in Tabulate can be published to other users using the Publish module. An OpenAI integration assists creators in writing formulas, SQL queries and even Python scripts within the platform. On top, generative AI is used to deliver additional flavors of NLQ and NLG for distinct purposes.

User & Use Cases
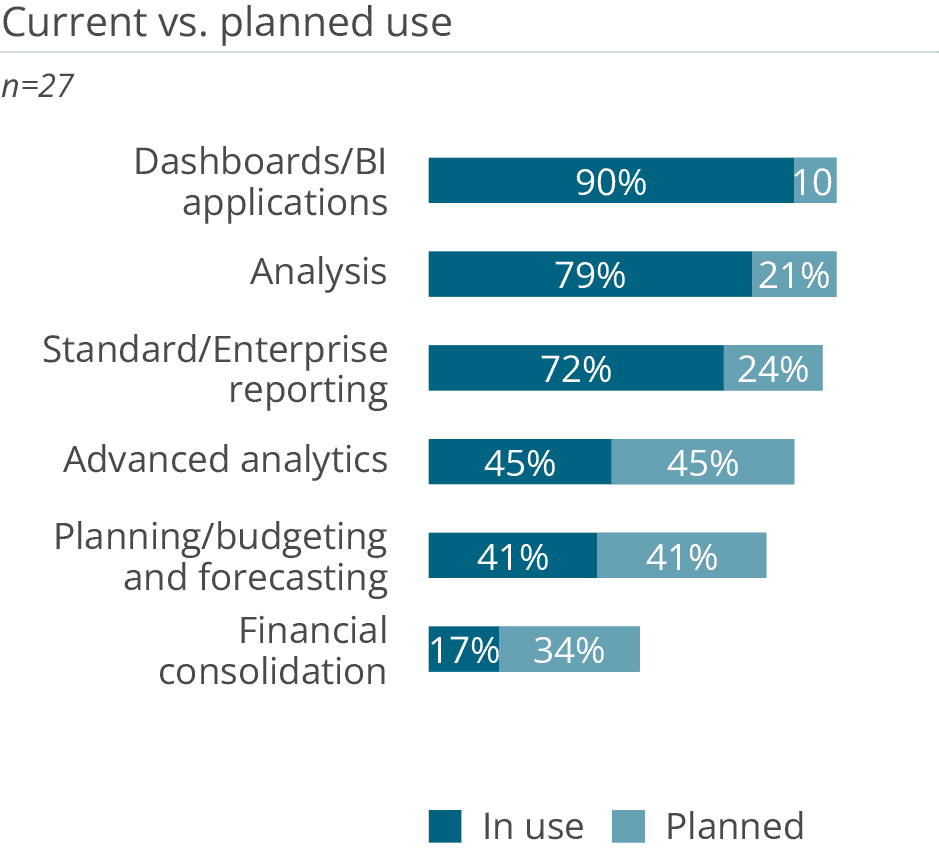
Pyramid serves a wide range of user needs. The product is most commonly used for dashboards and analytical applications (90 percent) and analysis (79 percent). A few years ago, enterprise reporting was used more frequently than dashboards. Now, only 72 percent of respondents use the product for enterprise reporting. This marks an interesting shift in the use of the platform, caused not only by the market trend, but also as a result of the vendors’ efforts to improve its dashboard capabilities.
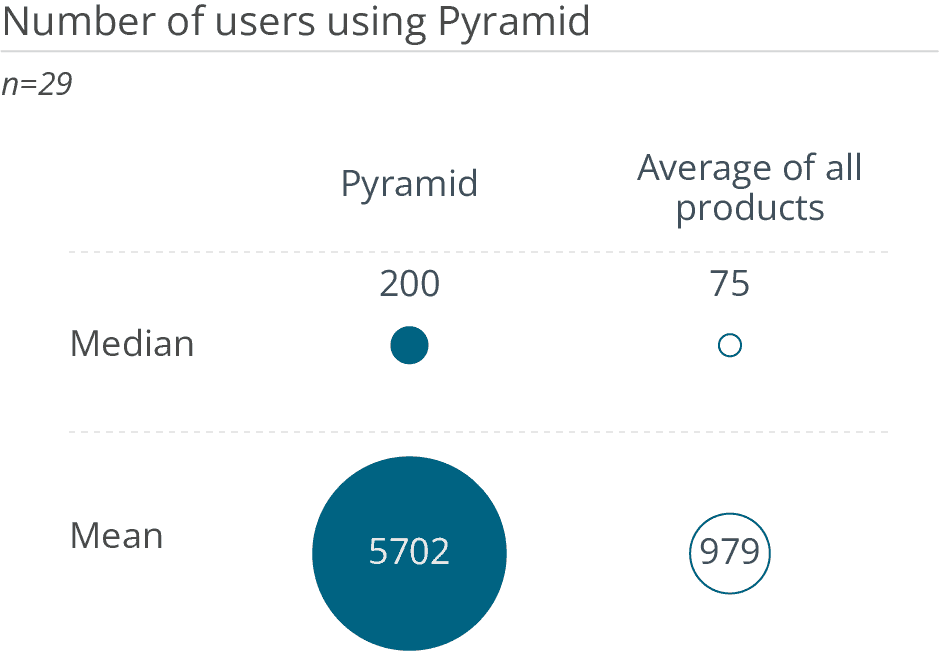
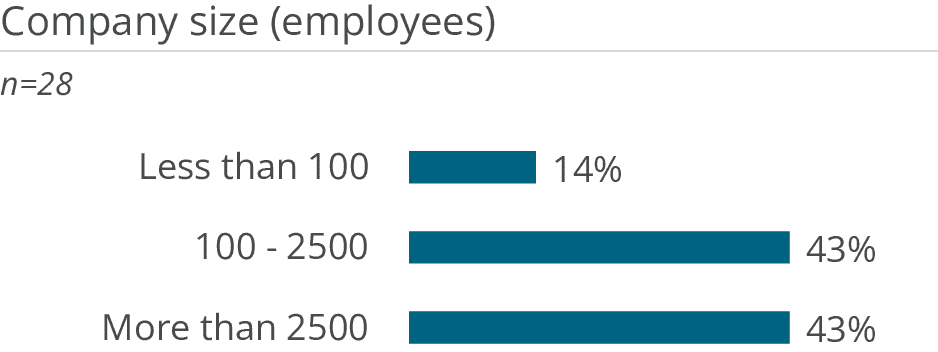
Advanced analytics functionality is used by 45 percent of respondents, a significant increase from previous years. Pyramid offers native Python integration into the product’s data flows and has also extended its support for GenAI through its OpenAI integration. This support for advanced analytics is a key differentiator for Pyramid. 86 percent of this year’s respondents were from medium and large enterprises with a median of 200 users. The mean of 5,702 users shows a significant increase in the number of large deployments.
Summary of Pyramid highlights
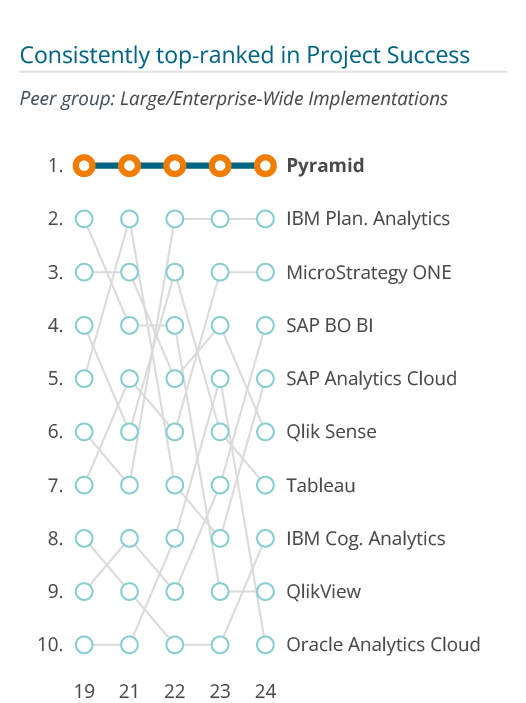
To measure Project Success, we asked customers to rate their satisfaction with various aspects of their implementation projects. Several factors contribute to the perception of a successful BI and analytics project, such as completing a project on time and within budget, and, of course, satisfaction with the implementation itself.
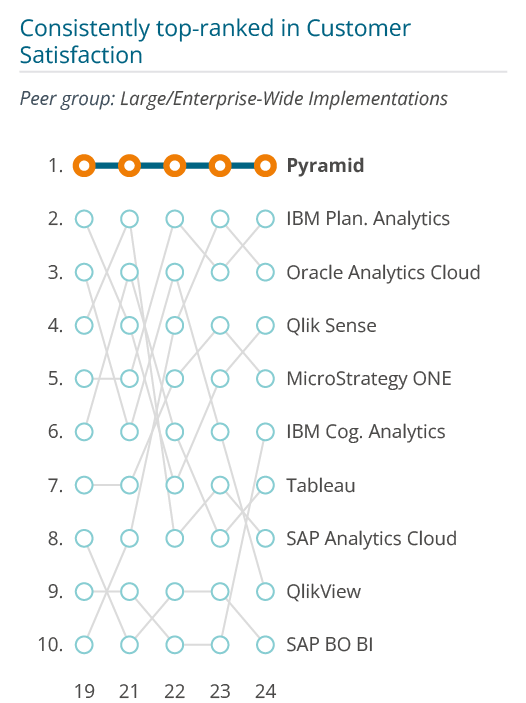
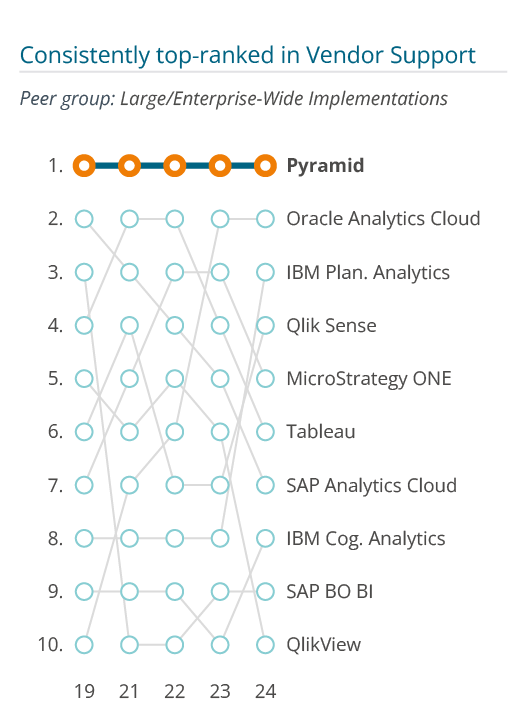
Users gave Pyramid higher than average ratings for all aspects of their projects. As a result, Pyramid is ranked number one in two of its peer groups and among the leaders in all other peer groups. This is not surprising, as Pyramid has held the top spot in the Large/Enterprise-Wide Implementations peer group for five years.
The Vendor Support KPI shows how satisfied customers are on average with the support provided by the vendor during implementation and operation. World-class support is critical for buyers who want to realize significant benefits on an ongoing basis. Poor support is a major reason for a significant number of abandoned implementations.
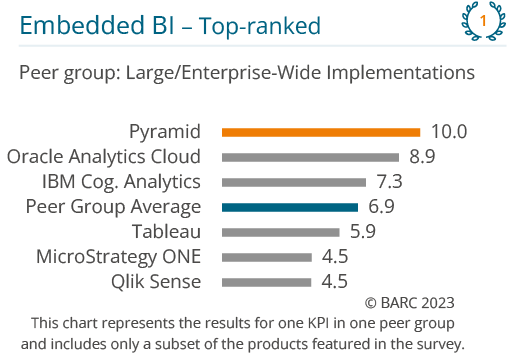
Pyramid satisfies most of its customers with a software that is too often neglected by other BI and analytics platform vendors that focus on the enterprise segment of the market. This fact is highlighted by the significant gap between Pyramid – as the top-ranked product in the Large/Enterprise- Wide Implementations peer group – and the runner-up.
Want to see the whole picture?
BARC’s Vendor Performance Summary contains an overview of The BI Survey results based on feedback from Pyramid users, accompanied by expert analyst commentary.
Contact us to purchase the Vendor Performance Summary- Register for a free sample Vendor Performance Summary download
- If you have any questions, feel free to contact us