Skip to content
Contact
Newsletter
Shop
0,00
€
0
Cart
Search
Search
Close this search box.
Main Menu
BARC Homepage [EN]
BARC Homepage [DE]
Ecosystems
Research
Magazine
Events
About BARC
Main Menu
Home
Solution Browser
Success Stories
Service Partners
Map
Events
Blog Portfolio
FAQ
Microsoft Power BI & Fabric Ecosystem
The world´s most comprehensive guide to the Microsoft Data & Analytics ecosystem
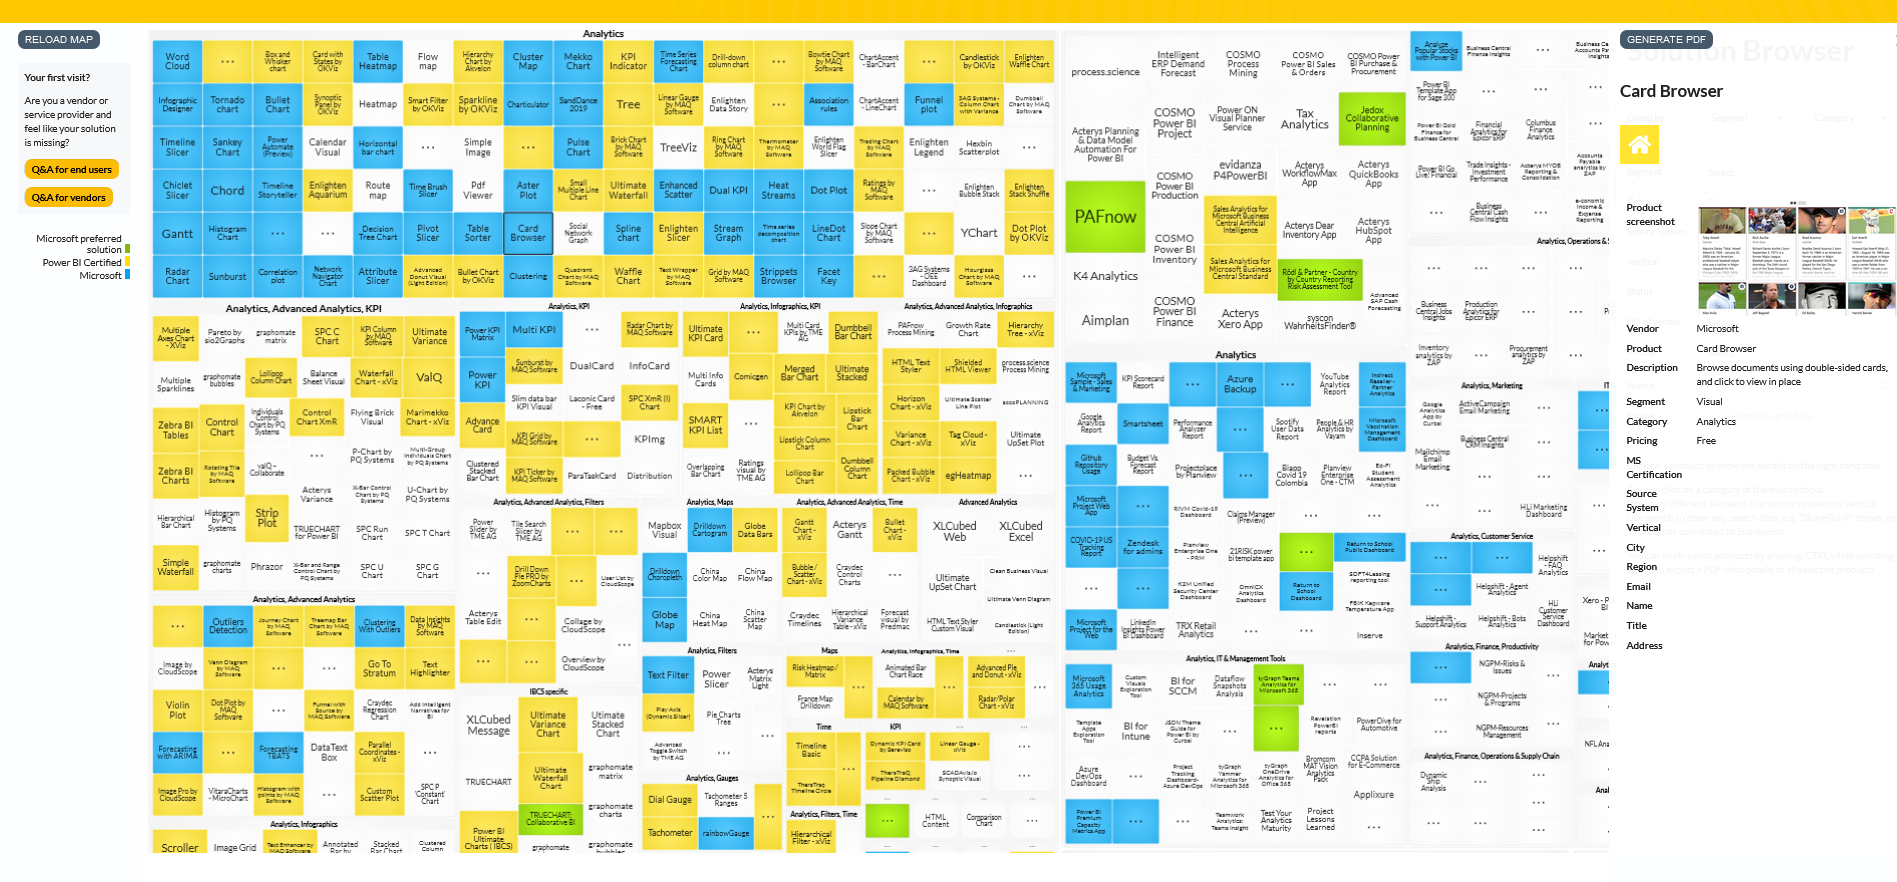
Solution Browser
The best add-ons for Power BI
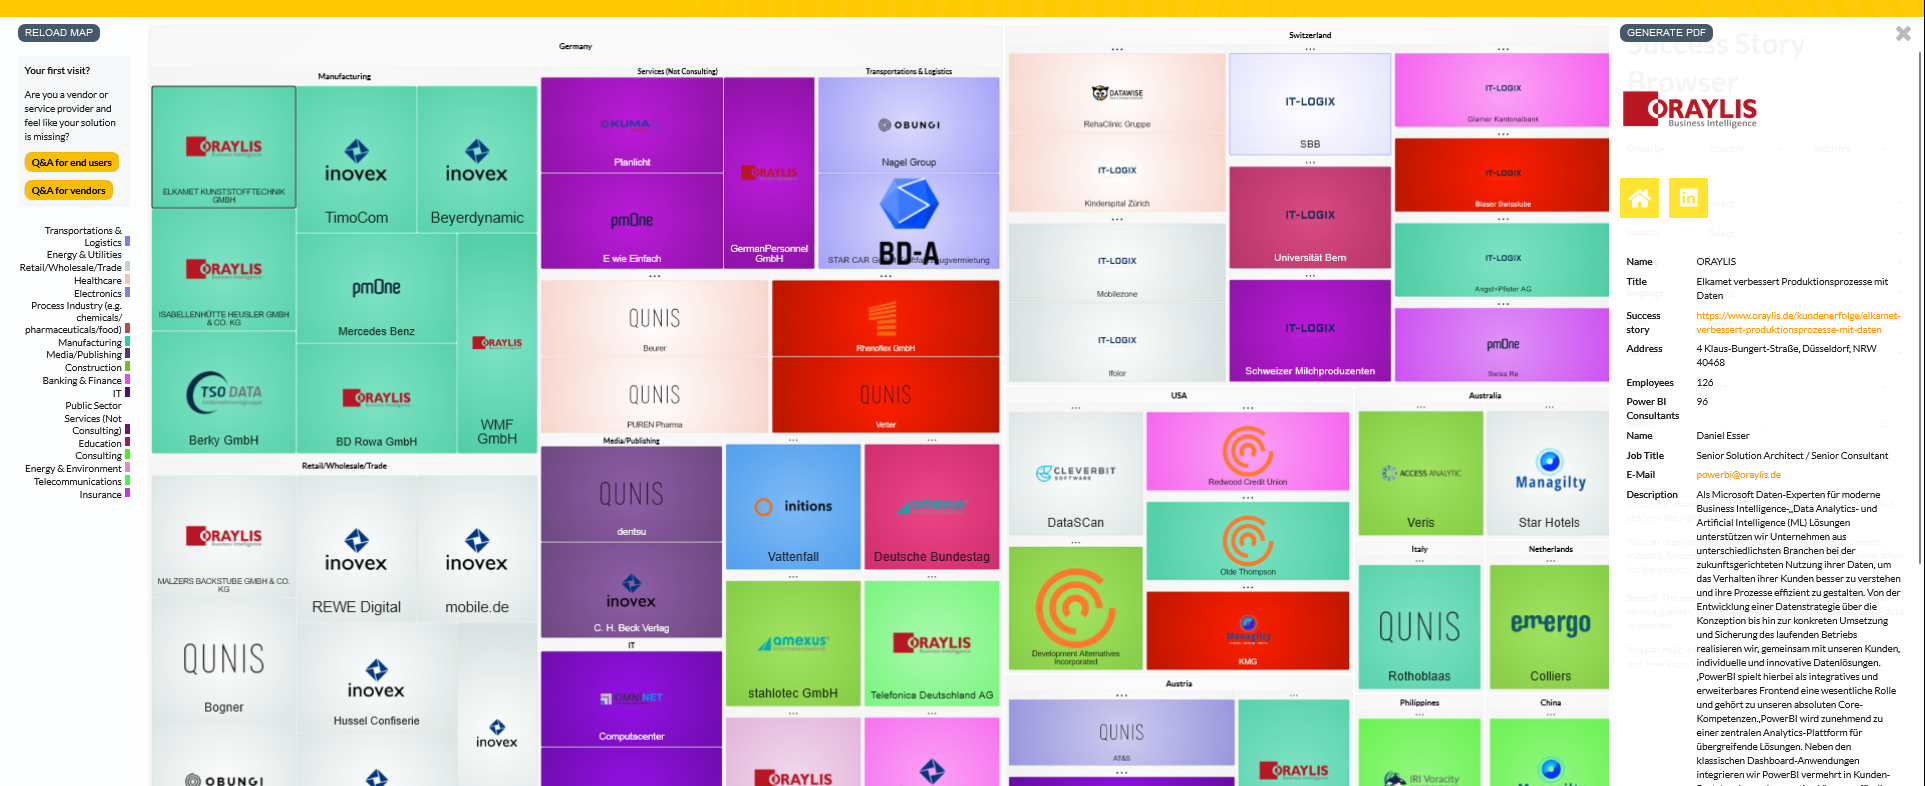
Success Stories
See how companies succeed using Power BI
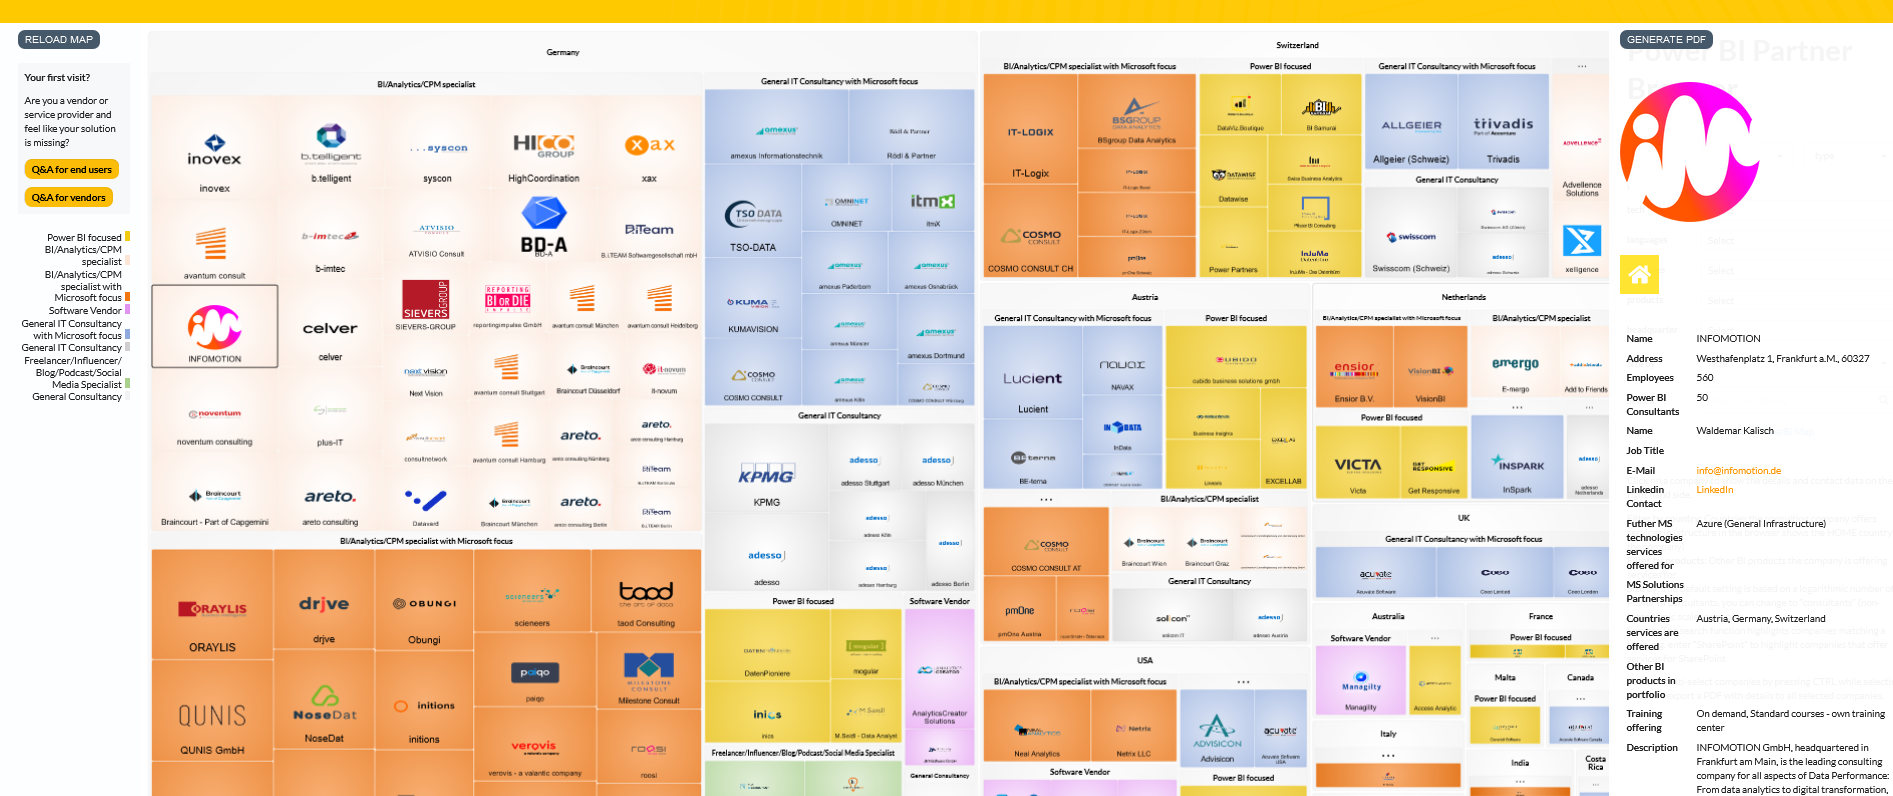
Service Partners
Find the right partner for your Power BI project
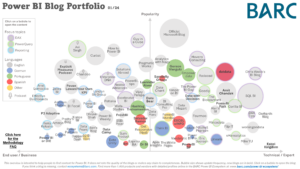
Blogs
100 Blogs for Power BI - 2024 Edition
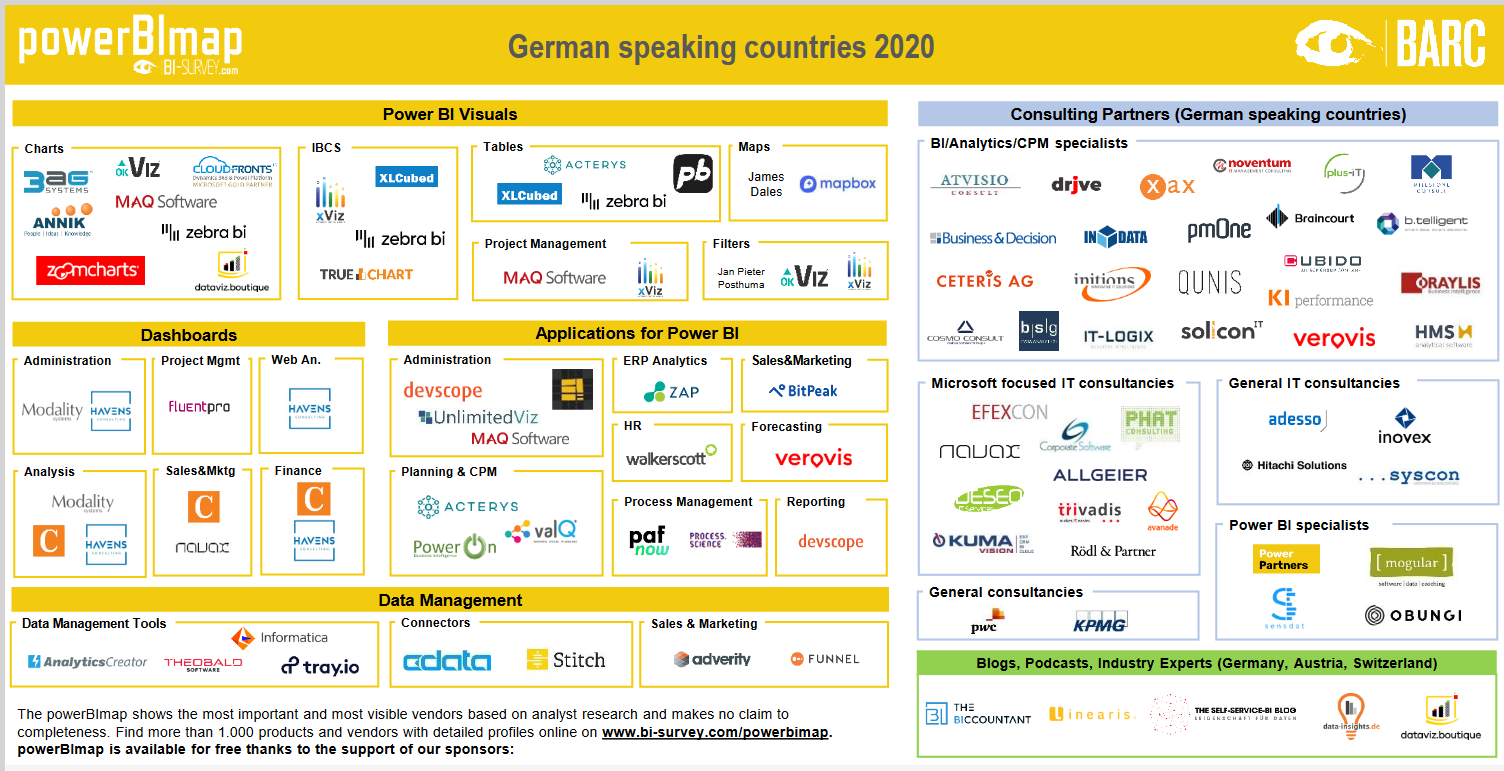
Map
Power BI Map for German speaking countries
Planning in Power BI
Planning and budgeting in Power BI
Brought to you for free by our sponsors
Related BARC Blogs
Article
Microsoft Integrates Python into Excel: Analyst View
Article
BARC Perspective on Microsoft’s Announcement of “MS Fabric”
Article
Power BI – The Winner Takes it All?
Anything unclear? Check out the Frequently Asked Questions.
FAQ
Are you missing any solutions, providers, blogs or content?
Contact us
Loading...
Contact us at
ecosystems@barc.com
or on LinkedIn:
Donald Farmer
Power BI & Fabric Ecosystem
North America
Stefan Sexl
Power BI & Fabric Ecosystem
Europe
Norman Manley
Power BI & Fabric Ecosystem
Benelux
Check out the world´s most comprehensive guide to the Power BI ecosystem.
The best add-ons for Power BI