Finding the Right Business Intelligence Tool
Which is the best business intelligence (BI) tool? What makes it the best one? What do existing customers think of their BI tools? Is the best business intelligence software also the right one for my business? Which criteria are the most important when comparing BI tools? Is superior functionality the main factor to consider? Or are aspects like vendor and implementer support equally important? And how do independent analysts rate different business intelligence solutions?
Comparing BI tools is no easy task. Especially since there are so many products on the market, all promising they will deliver all sorts of business benefits while at the same time solving all manner of problems.
Naturally, companies searching for a new business intelligence software tool can become overwhelmed with all the choices and promises from vendors.
To make the comparison and search for the best tool for your company easier, this article sets out to provide you with a balanced view of what BI users – as well as BARC analysts – have to say about the leading business intelligence and analytics products on the market.
By combining our in-depth knowledge of current BI and analytics software tools with one of the largest databases of user reviews of business intelligence software, we aim to guide you through the first steps to finding the best tool for your company.
We believe a combined view of user feedback and in-depth analyst perspective is necessary in order to fully appreciate how business intelligence software tools compare against each other, and to understand which are the best ones for your company.
In this article you will find out:
- how BARC analysts rate the products (BARC Score Enterprise BI & Analytics Platforms)
- the most important lessons learned from surveying more than 30,000 respondents about business intelligence software usage and selection over the last 20 years
The BI & Analytics Survey: Head-to-Head BI Tools Comparison
The interactive dashboard below lets you compare two business intelligence tools. The comparison is based on the aggregated KPI results from The BI & Analytics Survey 24. See how they stack up against each other by selecting a peer group and then two business intelligence software products of your choice.
No one knows more about how a business intelligence tool performs in the real world than the customers already using it. All too often, they find that products don’t live up to expectations, or that the vendor does not support its product properly. Therefore, when comparing BI software, there is almost nothing more valuable than user reviews.
This is where The BI & Analytics Survey comes in. Collecting feedback from business intelligence and analytics software users every year for the last 22 years, The BI & Analytics Survey provides detailed analysis of which software products get the best user ratings. This year, The BI & Analytics Survey is based on the analysis of the real-world experience of 1,480 respondents with 1,317 answering a series of detailed questions about their usage of a named business intelligence software tool.
It is the largest and most thorough fact-based analysis of the BI and analytics software market currently available, using over 20 years of experience to analyze market trends and challenge some of the myths surrounding the business intelligence software industry.
This edition features a broad range of software tools, not only from the well known business intelligence giants, but also specialist products from much smaller vendors and open source vendors that ordinarily don’t get much press but which, in many cases, offer outstanding value to their customers.
Altogether, The BI & Analytics Survey compares 21 business intelligence tools (or groups of products) in detail. To be included in the detailed analysis, a tool requires at least 30 user reviews.
Since not all business intelligence tools are alike, we use peer groups to ensure similar products are compared against each other (see below for more information on the peer groups). The groups are essential to allow fair and useful comparisons of solutions that are likely to compete.
The KPIs
Business Value is possibly the most important KPI, focusing on bottom line benefits of BI projects. Business benefits are the real reason for carrying out any BI/analytics project. Business intelligence that does not deliver broad business value is superfluous.
The Business Value KPI shows how a successful BI software product can provide these benefits in the real world. The KPI combines the Business Benefits, Project Success and Project Length KPIs.
Delivering a superior user experience is more important than ever. BI professionals don’t want to have to spend a lot of time figuring out how a product works, attempting to learn interfaces or waiting around for a query to finish. With the current vogue for agility and self-service BI capabilities and the increasing need for users to be able to access a variety of data sources, the user experience of a BI tool is an important consideration for many organizations.
To calculate the quality of user experience of a BI tool, we combine the Ease of Use, Flexibility and Performance Satisfaction KPIs.
Happy customers are a strong indicator of a superior software. We combine the Price to Value, Recommendation, Vendor Support, Implementer Support, Product Satisfaction and Sales Experience KPIs to calculate an aggregated Customer Satisfaction KPI. These factors are clearly related: If one is lacking, then the importance of the others is accentuated.
The Competitiveness KPI gives insights into how BI tools perform in a competitive selection process as well as the strength of a product’s market presence. It combines the Considered for Purchase and Competitive Win Rate KPIs.
Recognizing which business intelligence software to compare entails understanding which tools have fared well in other organizations’ product selections. This enables users to eliminate ‘losers’ at an early stage in the selection process.
The KPI rules
Only measures that have a clear good/bad trend are used as the basis for KPIs.
KPIs may be based on one or more measures from The BI & Analytics Survey.
Only products with samples of at least 20-30 (depending on the KPI) for each of the questions that feeds into the KPI are included.
For quantitative data, KPIs are converted to a scale of 1 to 10 (worst to best). A linear min-max transformation is applied, which preserves the order of, and the relative distance between, products‘ scores.
Comparing BI software with the help of peer groups
Not all BI tools are alike. Some are strong on reporting, while others are more suitable for dashboards or analytics.
Results from The BI & Analytics Survey show the types of capabilities respondents use with their BI and analytics tools. Standard and enterprise reporting is top of the list followed by ad hoc query. The least popular BI capability this year is advanced analysis (i.e., predictive analytics or data mining), although it has the highest ‘planned’ rates, with 48 percent of respondents intending to start using advanced analytics in the future.
The peer groups are primarily based on the results from the survey. They take into account how customers say they use the business intelligence software, which can vary widely across the different products. But we also include the experience and judgment of the BARC analysts in deciding on the groupings.
Peer groups are simply a guide to the reader to help make BI tools easier to compare and to show why individual products return such disparate results. They are not intended to be a judgment of the quality of the tools.
Some products appear in more than one peer group. We use these peer groups in a consistent way in our analysis, as well as in The BI & Analytics Survey Analyzer.
The point to the peer groups is to make sure that the comparisons of the BI tools we make in the survey make sense. The products are grouped together as we would expect them to appear in a shortlist for business intelligence software selection.
To make a proper choice, a buyer should first segment the market into the tool types that fit the requirements of the business. Peer groups are intended to help with this task.
The segmentation of the peer groups is based on four key factors:
- Focus – Is the product focused on and typically used for reporting and dashboards, analysis or embedded analytics?
- Specialization – Is the product focused on and typically used for reporting and dashboards, analysis or embedded analytics?
- Usage scenario – Is the product typically used in midsize/departmental implementations or large/enterprise-wide implementations?
- Global presence – Does the vendor have a global reach and offer its products worldwide?
The peer groups
Includes products that focus on ad hoc query, data navigation and analysis.
BI & Analytics specialists are software vendors who focus solely on BI and/or analytics. Often, they have just one product in their portfolio.
Business software generalists have a broad product portfolio that is not limited to BI and analytics, including most (or all) types of enterprise software for a variety of business requirements (e.g., ERP).
Includes reporting and analytics products that can be embedded in other business applications (e.g., ERP systems).
Includes products from companies with annual revenues of $200m+ and a truly international reach (partner ecosystem, on-site locations, global installations and revenues).
Products in this peer group are typically (but not exclusively) used in large scenarios and/or enterprise-wide implementations with a large number of users and data volumes.
Products in this peer group are typically (but not exclusively) used in small and midsize scenarios and/or departmental implementations with a moderate number of users and data volumes.
Includes products that focus on the creation and distribution of standardized and governed content such as dashboards or reports.
Tasks where BI is used
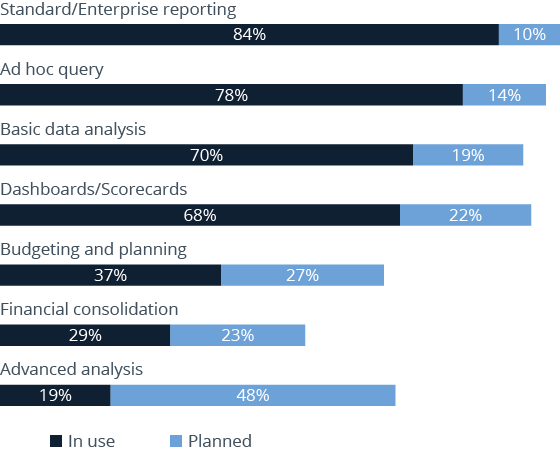
Tasks where BI is used (n=1,555)
Want to rate your BI and analytics software?
Share your experience in the world‘s largest and most comprehensive survey of BI software users
Take part in The BI & Analytics Survey
BARC Score Enterprise BI & Analytics Platforms: The Analyst Comparison of Leading BI Tools
BARC Score Enterprise BI & Analytics Platforms compares the strengths and challenges of all the leading vendors in the business intelligence market as well as many smaller vendors that often have less visibility but equally offer outstanding value to their customers.
Based on countless data points and many analyst interactions, business intelligence software vendors are rated on a variety of criteria, from product capabilities and architecture to sales and marketing strategy, financial performance and customer feedback.
Calculating the individual ratings for all criteria and all vendors produces two scores per company: the ‘portfolio capabilities’ score and the ‘market execution’ score, which are plotted on each axis resulting in the vendor’s dot on the BARC Score graphic.
‘Portfolio Capabilities’ includes a series of weighted criteria based on three major areas: functionality, infrastructure and product-related evaluation criteria.
‘Market Execution’ takes into account a blend of product, sales and marketing strategy as well as certain organizational, financial and geographical considerations.
There are two separate inclusion criteria categories for this BARC Score: the first is associated with a vendor’s products and the other is linked to the financial results relating to those products. To be evaluated in this BARC Score, a vendor has to have a strong focus on providing BI and analytics functionality and supply four out of six technologies from the following functional portfolio:
- Formatted and Ad Hoc Reporting
- Dashboards
- Analysis
- Advanced Analytics
- Planning
- Self-Service BI and Data Discovery
In addition, the vendor has to generate a minimum of 15 million Euros in license revenue per year with the above product set, spread across at least two separate geographies. Furthermore, the product set must have a significant number of implementations and license revenues across different geographies to be considered as global. As individual geographies we consider:
- Europe, Middle East and Africa
- North America
- Latin America
- Asia/Pacific
Vendors with an open source business model are evaluated by their total revenue because they do not charge a license fee for their products, but an annual subscription fee.
BARC Score Enterprise BI and Analytics Platforms 2022
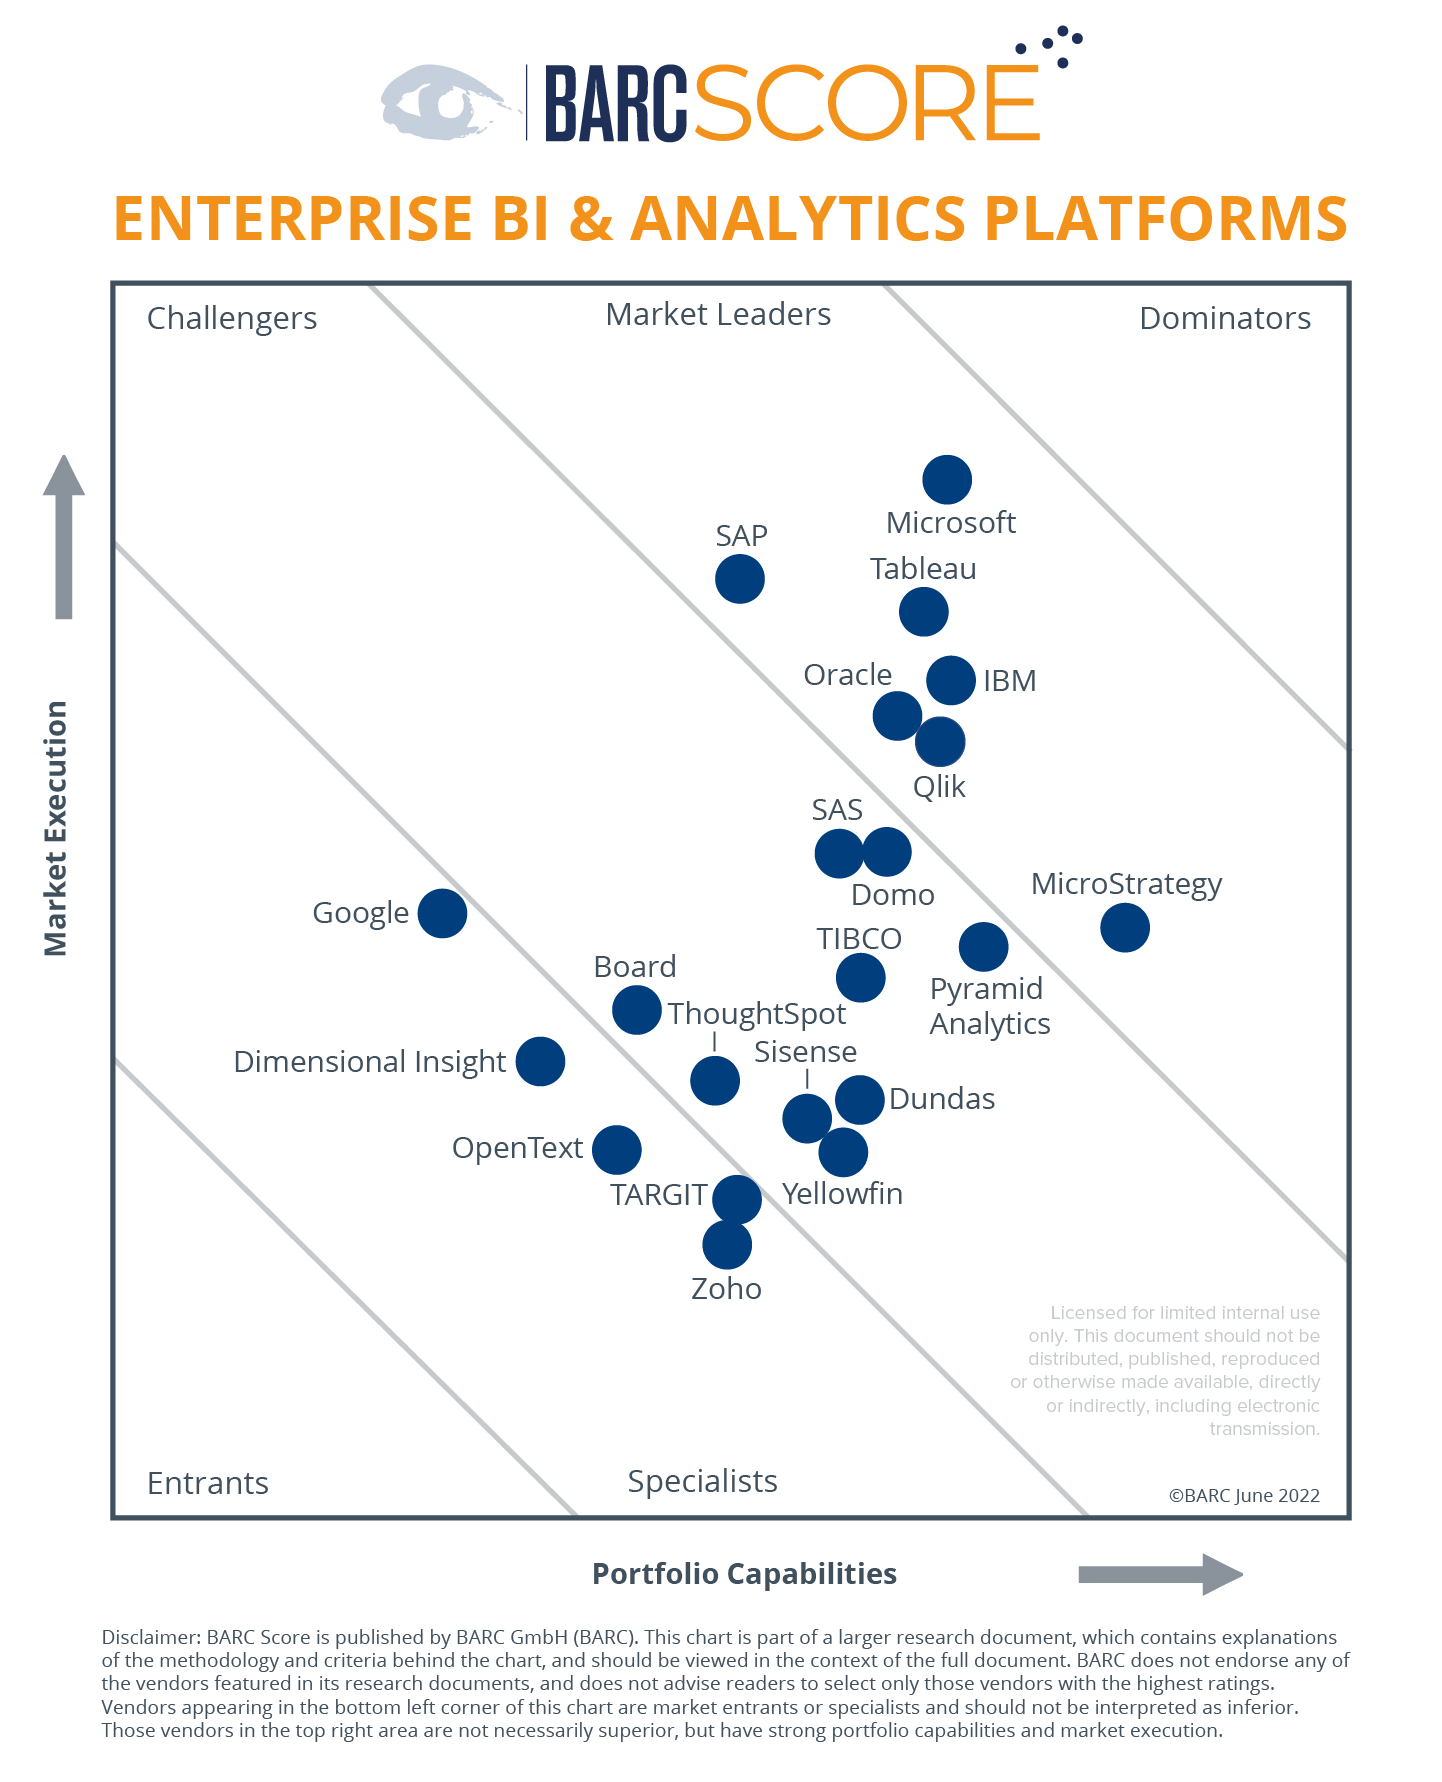
Score Regions

What We Have Learned About Comparing Business Intelligence Software
Why the choice and comparison of business intelligence products is important when it comes to finding the best tool
Business intelligence projects are about creating business value by enabling better business decisions. An important – though not the only – part of this value creation is derived from the BI software products that gather, enrich, store and present data to end users, business analysts, or even data scientists.
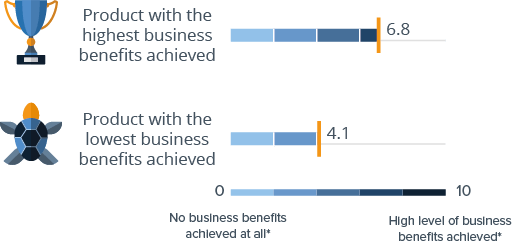
Choosing a software product that does not match your requirements can pose a serious threat to the success of your project. Survey results show major differences in the business benefits achieved with different BI tools.
The Business Benefits Index (BBI) is a unique measure used in The BI & Analytics Survey to determine the value of BI projects. It takes both quantitative and qualitative benefits into account as well as different levels of possible benefit achievement. Here you can find more detailed information on how we calculate the BBI and how we classify best-in-class companies.
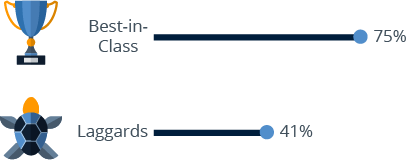
Percentage of businesses doing a competitive BI software evaluation (n=1,309)
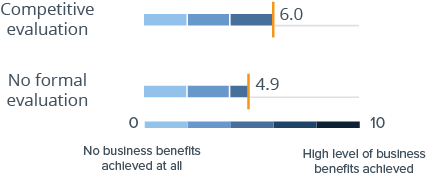
Business benefits by selection type (n=1,309)
How to select a BI product
Selecting the best business intelligence software is key to a successful project, and many software problems can be traced back to poor software selection processes.
The software is often used for ten years or more so the total cost of ownership (TCO) can be substantial. Investing time in choosing the best business intelligence software tool will have positive long-term effects.
Before purchasing and committing to any BI tool, we always recommend that organizations conduct detailed, formal evaluations of multiple products on the market.
However, we are aware that not everyone follows this advice. The data collected in The BI & Analytics Survey allows us to draw some definite conclusions on this topic.
The findings from our survey reflect those stretching back to 2001 in that business benefits improve when a company performs a product evaluation and benefits are further improved if enterprises extend the formal assessment process to a multi-vendor comparison.
What are the right criteria for evaluating BI software
The criteria best-in-class companies use for selecting their BI software confirm that successful projects are based on selecting the tool rather than the vendor.
This is one of the most consistent findings over The BI & Analytics Survey’s 20+ year history.
- Best-in-class companies take more selection criteria into account than laggards.
- Best-in-class companies are much more interested in functionality, ease of use and fast query performance; all key considerations in enabling self-service BI.
- Laggards, on the other hand, are more concerned with non-product-related criteria such as ‘vendor listed as corporate standard’ or ‘bundled with another product’.
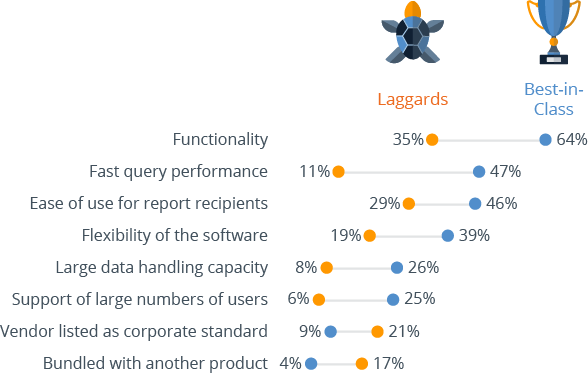
Reasons for buying BI software tool (n=1,424)

Median implementation time (n=1,555)
Why implementation speed matters for a BI & analytics tool
Countless IT projects experience delays and data warehousing and business intelligence projects are by no means immune to this perennial issue.
Implementation time depends largely on which product is being implemented. Naturally, the complexity of the solution and/or the project will impact on project length and certain products lend themselves better to more complex projects, thus increasing their average implementation time.
Clearly, other factors such as the number of data sources, the volume of data and the number of users or departments served also have an influence here.
Fast implementation times are key to a successful BI project. Projects taking more than three months to complete lead to significantly lower business benefits. Project implementation times appear to have a direct impact on the level of all business benefits; with benefits decreasing as project length increases.
Aim for a three-month implementation window for the first application. Best-in-class companies prove that it can be done in just two months on average.
If possible, try an incremental approach by breaking the project into a series of smaller projects.
Why good support is especially important
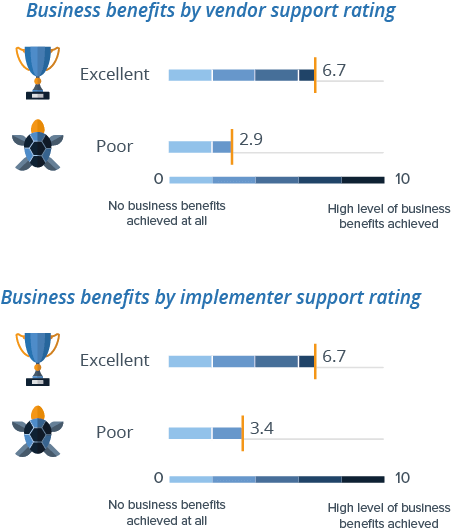
The standard of service provided by consultants varies considerably. The BI & Analytics Survey asks business intelligence users about their experiences with external implementer support as well as vendor support. We found a clear correlation between customer ratings of implementer and vendor support and business benefits achieved.
Seeing such a big difference in business benefits between different types of consultants does not come as a surprise. Good support from an implementation consultant is an important aspect of project success.
Finding the right vendor in combination with the right implementer is crucial to project success. In previous editions of The BI & Analytics Survey, we used to ask about the type of consultants companies used. Results revealed that small, specialized consulting firms frequently scored better than large general-purpose consulting companies.
The success of business intelligence projects depends upon organizations’ and vendors’ abilities to deliver successful and relatively rapid implementations, along with supportive follow-up and maintenance.
Many BI and analytics solutions end up as shelfware within enterprises due to difficulties in setting up software, difficulty in using tools, or lack of ability to communicate the benefits of the tools and platforms to end users.
The ability to seamlessly incorporate business intelligence software and platforms into corporate decision-making processes and to closely align those solutions into business results is crucial.
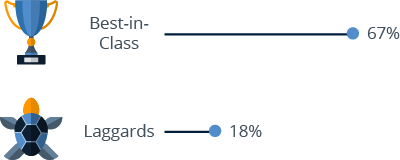
No significant problems with the BI tool by
best-in-class companies (n=1,493)
Avoiding problems
Survey results clearly reveal that a carefully conducted comparison and selection of business intelligence tools pays off. The organizations that achieve the greatest level of business benefits with business intelligence (best-in-class companies) are much more likely to have conducted a competitive product evaluation, and they experience far fewer problems with their BI & analytics software.
