
Implementation, support and challenges of successful business intelligence projects
Once the evaluation, selection and acquisition processes are complete, work begins on the implementation. Success often hinges on many factors: from functional engagement to product fit to technical resource availability. A successful, timely BI implementation requires a combination of customer and vendor resources as well as leadership that can align company processes with a new BI product.
As The BI Survey results demonstrate, a good implementation with responsive support is crucial as users begin navigating interfaces and spotting data issues. The ability to seamlessly incorporate BI software into existing operations ultimately makes or breaks implementations. Earlier we saw that user satisfaction with BI is high. It is also clear that the normal situation is for no serious problems to be encountered, as shown in the chart below.
Implementation problems timeline view (n=2198)
Hover over the text/dots to display more information
Implementation problems timeline view (n=2198)

The chart above shows that while the greatest likelihood is that no serious problems will be encountered, that score is less than 50 percent. However, the trend line is moving in a positive direction for buyers and implementers. Of the serious problems that are encountered, most are on a downward trend or flatlining. Survey responses also indicate that a wide range of serious problems may be encountered. Notably, the most likely is a lack of resources in the project team, although the reasons for the lack of resources are not disclosed. It is possible, for example, that cost isn’t the major factor, given the business benefits garnered by many projects, but that a lack of availability of skilled resources is the main issue. Certainly, a lack of resources on the part of the implementation partner is not a common problem. At less than 5 percent, it is the least frequently experienced problem.
The chart below provides a similar spread of scores on serious problems (or the lack of them) for business users.
Usage problems timeline view (n=2198)
Hover over the text/dots to display more information
Usage problems timeline view (n=2198)

Once again the highest score is for ‘no significant problems’, at less than 50 percent but trending in a positive direction. Of note here is that when problems do occur, they are sometimes of a different nature to the implementation problems. For instance, slow query performance is the most frequently occurring problem here, although it is on a downward trend.
Query performance varies quite widely across different types of projects. The figure below shows the range and median of typical query response times.
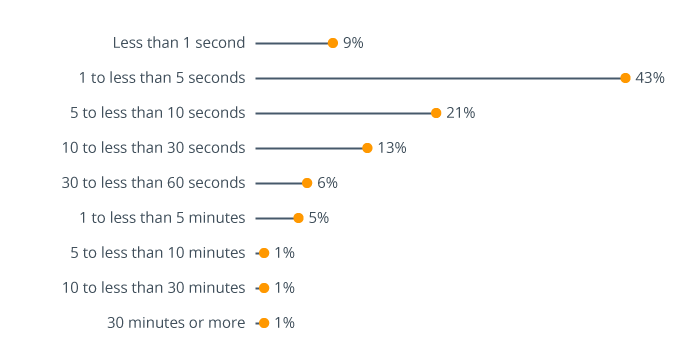
What is the typical query response time that end users see in your BI product? (n=2,414)
The majority of respondents see response times of less than 5 seconds (52 percent). Moreover, the median time for all respondents is just 5.71 seconds. While longer query response times are reported, this score is not yet directly linked to the performance expectations for a product. It does however provide context for the query performance problems seen by business users.
It is worth remembering at this point that while problems do occur, they can be resolved, especially where there is good support from the implementer and the vendor.

Support quality
The chart below shows scores on the quality of support from vendors and implementers.
In the case of both the vendor and implementer, support scores are high. The score for vendor support is at 66 percent for ‘excellent’ and ‘good’ combined, and for implementers at 65 percent for ‘excellent’ and ‘good’ combined. Substandard scores for ‘not very good’ and ‘very poor’ are very low indeed for vendors and implementers at just 7 percent and 4 percent respectively. It is also worth noting that 7 percent and 14 percent of respondents respectively say that vendor and implementer support has not been used so far. While this could point to an an outstanding experience, it might also indicate a project in the earliest stages of implementation.
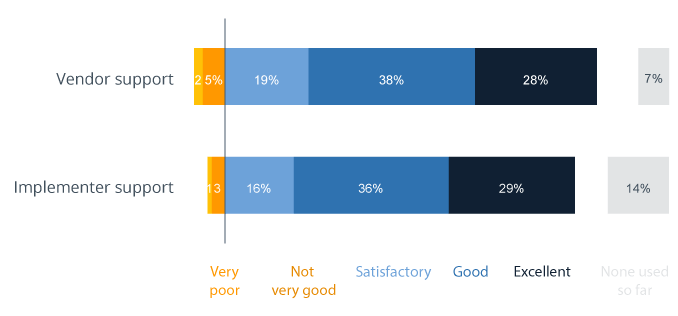
How do you rate the product support provided by the vendor and the implementer of the product? (n=2,557/2,511)
Implementation time
The median implementation time for projects is just under four months. It is well worth remembering that larger or more complex projects are highly likely to take longer than the median time. We also find that project implementation time is a significant source of business user satisfaction. Good satisfaction with the timeframe of projects is well over 60 percent, and poor satisfaction with the timeframe was a tiny minority.
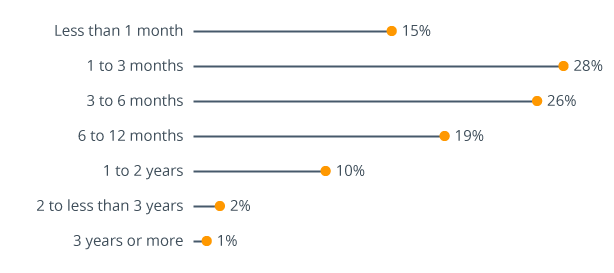
How long did it take to implement the BI aspect of the application from software purchase to initial rollout? (n=2,198)
Project timeframes for BI measured in years rather than months clearly do still exist, but the size and complexity of such projects is sometimes astronomical, involving multiple large organizations; changes in regulatory or other standards that must be observed; large, numerous, and sometimes very dirty data sources; internationalization of results and interfaces, and other complexities besides. In these cases, a long project is likely. It will be interesting to see in years to come if the growing adoption of an agile technology implementation methodology reduces the median and ‘long’ times further.
One final view of the impact of implementation times is through the lens of the Business Benefit Index (BBI):
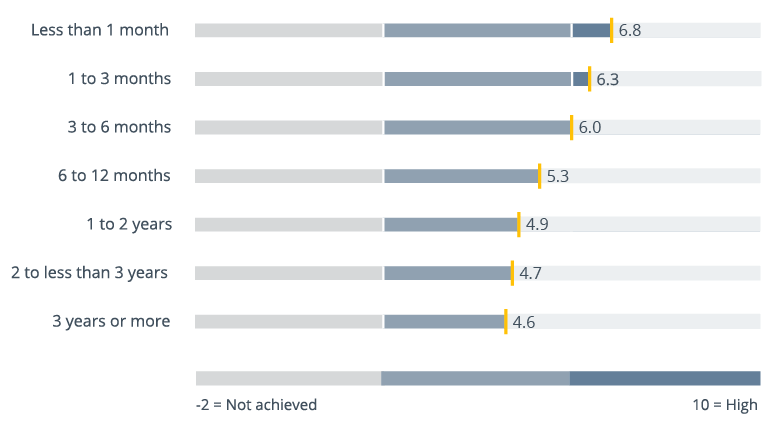
Business Benefit Index analyzed by implementation time (n= 2198)
The chart shows that there is a fair spread of BBI scores. Decent benefits are obtained by projects with the longest implementation times, but the score increases by around 50 percent for the shortest implementation times.